Introduction
Humans have been delving below Earth’s surface for tens of thousands of years. From the earliest maps of the spiritual underworld made by ancient man, to digital maps of the seabed produced today, the human need to explore and envision the world beneath our feet is age-old. In this exhibition, you will see how ancient Romans carved vast underground catacombs, how minerals and natural resources have been studied, engineered and transported since the 19th century, how today’s scientific and cartographic advancements have enabled us to picture the entire ocean floor, and what lies below the streets of Boston. As you explore nearly 400 years of maps and images of the world below, you can compare the historical viewpoint with the modern, and see how we have advanced our perception and depiction of what lies beneath.
1. Earth's Crust
Amos Eaton (1776-1842)
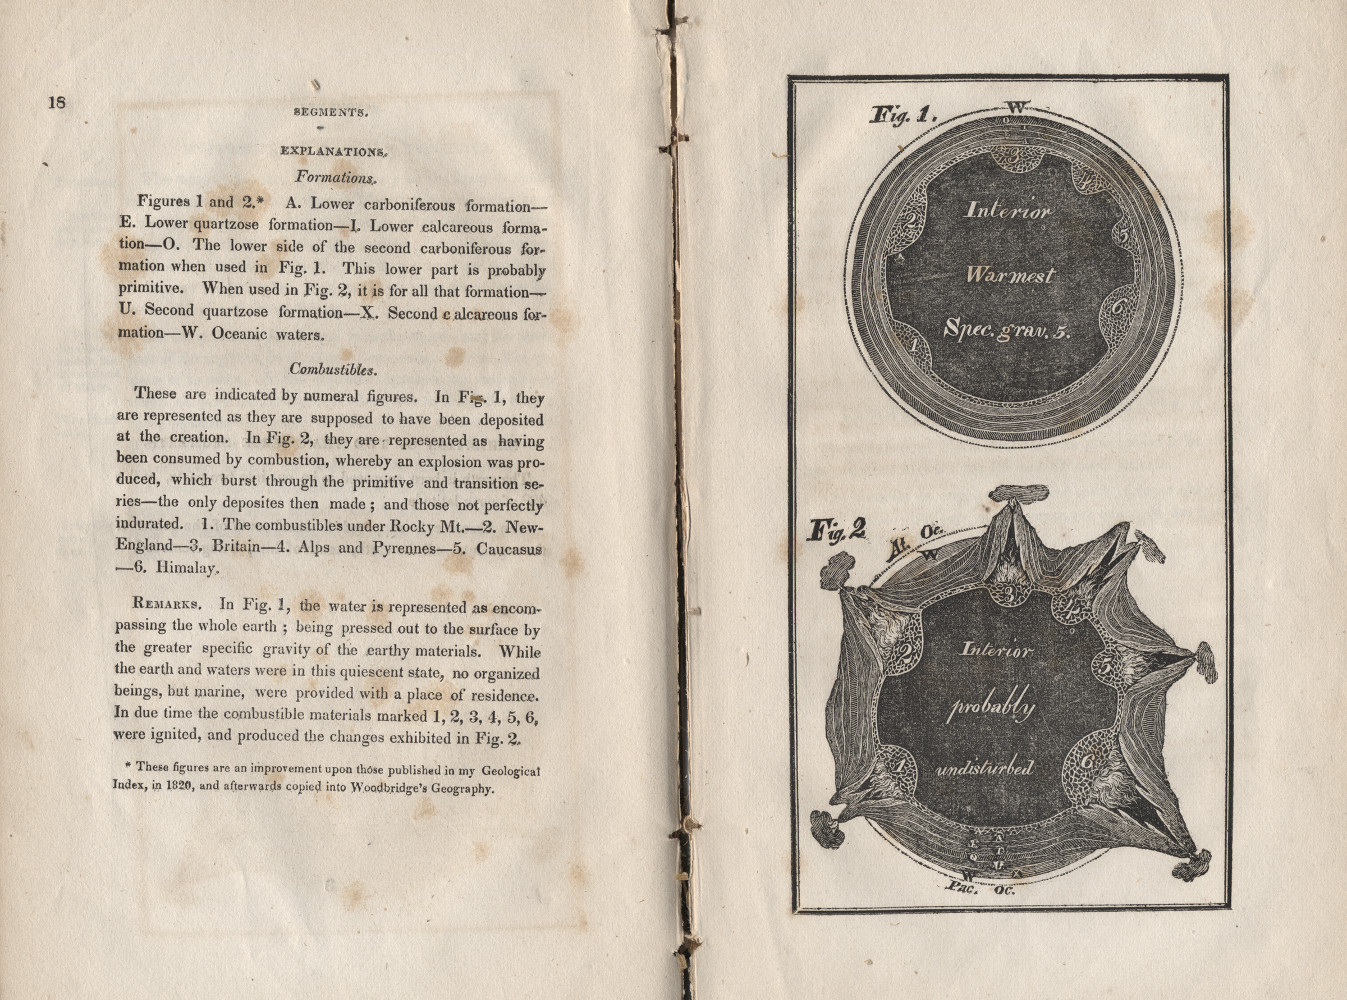
“Figures 1 and 2,” from “Geological Text-Book, Prepared for Popular Lectures on North American Geology …”
Albany, NY, 1830. Reproduction, 2017.
Courtesy Boston Public Library.
The quest to understand the origins of the earth date back millennia. For many years, American naturalists accepted the Old Testament origin account as indisputable evidence, but by the 19th century, the structure or composition of the earth became a topic for exploration and mapmaking. Amos Eaton, a natural scientist from New York State, produced these two views of Earth for his 1830 “Geological Text-book…” In “figure 1” Eaton presents the crustal layers of the earth as concentric rings surrounding a combustible inner core - at the time of creation. “Figure 2” shows volcanic mountains that formed when the explosive material in the core forced these structures to the surface.
Alexander Keith Johnston (1804-1871)
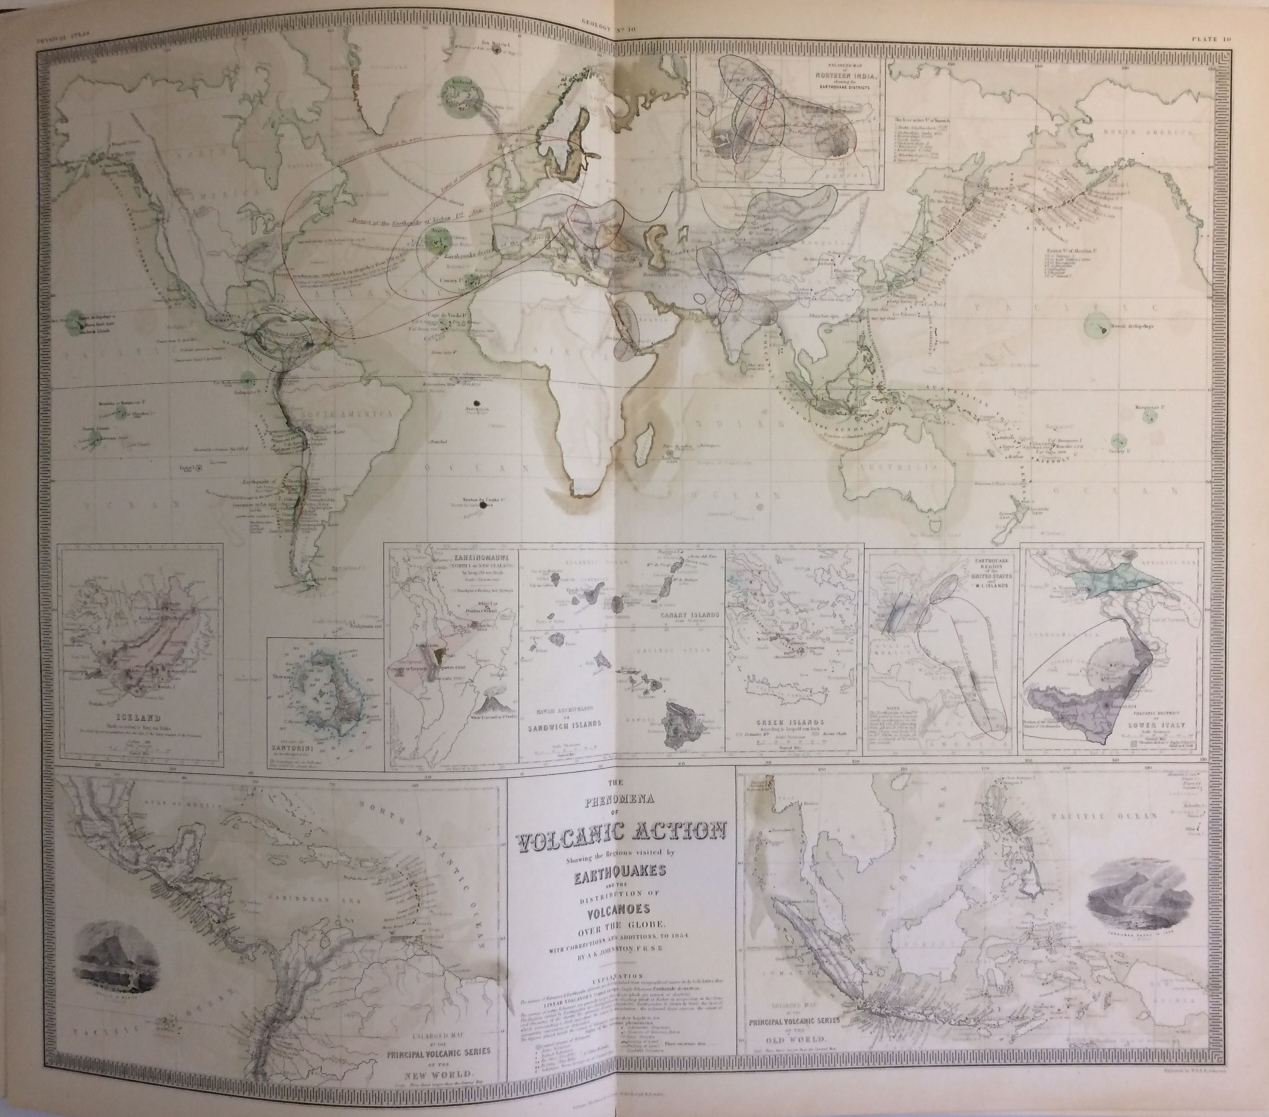
“The Phenomena of Volcanic Action Showing the Regions Visited by Earthquakes and the Distribution of Volcanoes over the Globe,” from “The Physical Atlas of Natural Phenomena”
Edinburgh, 1856.
In the 16th century, European scholars began commenting on how the shapes of the continents bordering the Atlantic Ocean seemed to fit together, as if they had once been connected. Throughout the following centuries this theory evolved, and in 1912 was presented by German meteorologist Alfred Wegener, who called his concept “continental drift.” Wegener hypothesized that between 200-300 million years ago there was one supercontinent which he named “Pangaea,” or, “all lands.” Both supported and opposed, Wegener’s theory served as a building block to the later concept of plate tectonics, which affects earthquakes and volcanoes. The 1856 atlas displayed here shows how earthquake and volcanic activity around the globe at that time was mapped.
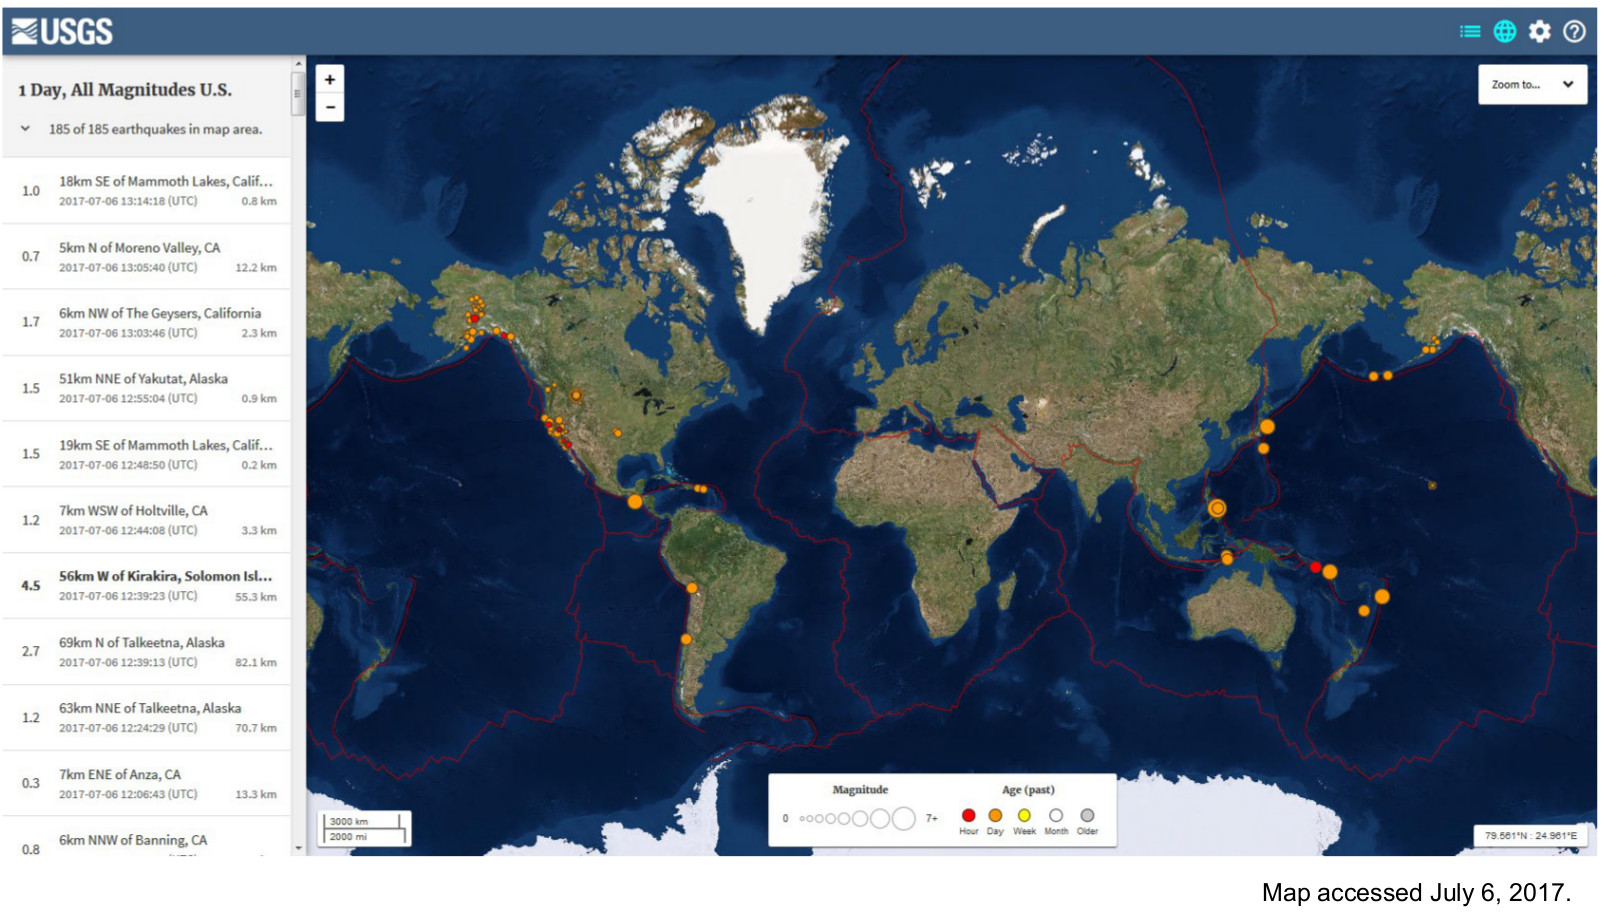
U.S. Geological Survey Earthquake Hazards Program
“[Worldwide Earthquakes, July 6, 2017]”
July 6, 2017.
Source: earthquake.usgs.gov
Earthquakes are caused by seismic waves – waves of energy that come from deep within the Earth – that cause the ground to shake. Earthquakes usually occur in areas where huge rocks move in relation to one another, called fault lines. Earth’s major fault lines are located at the boundaries of tectonic plates, although both earthquakes and volcanic activity can occur in the interior of plates. The map displayed here shows the location of “significant” earthquakes worldwide over the course of thirty one. Available online via the U.S. Geological Survey, this real-time earthquake map displays occurrences of seismic activity from around the globe. Available online via the U.S. Geological Survey, this real-time earthquake map displays occurrences of seismic activity from around the globe.
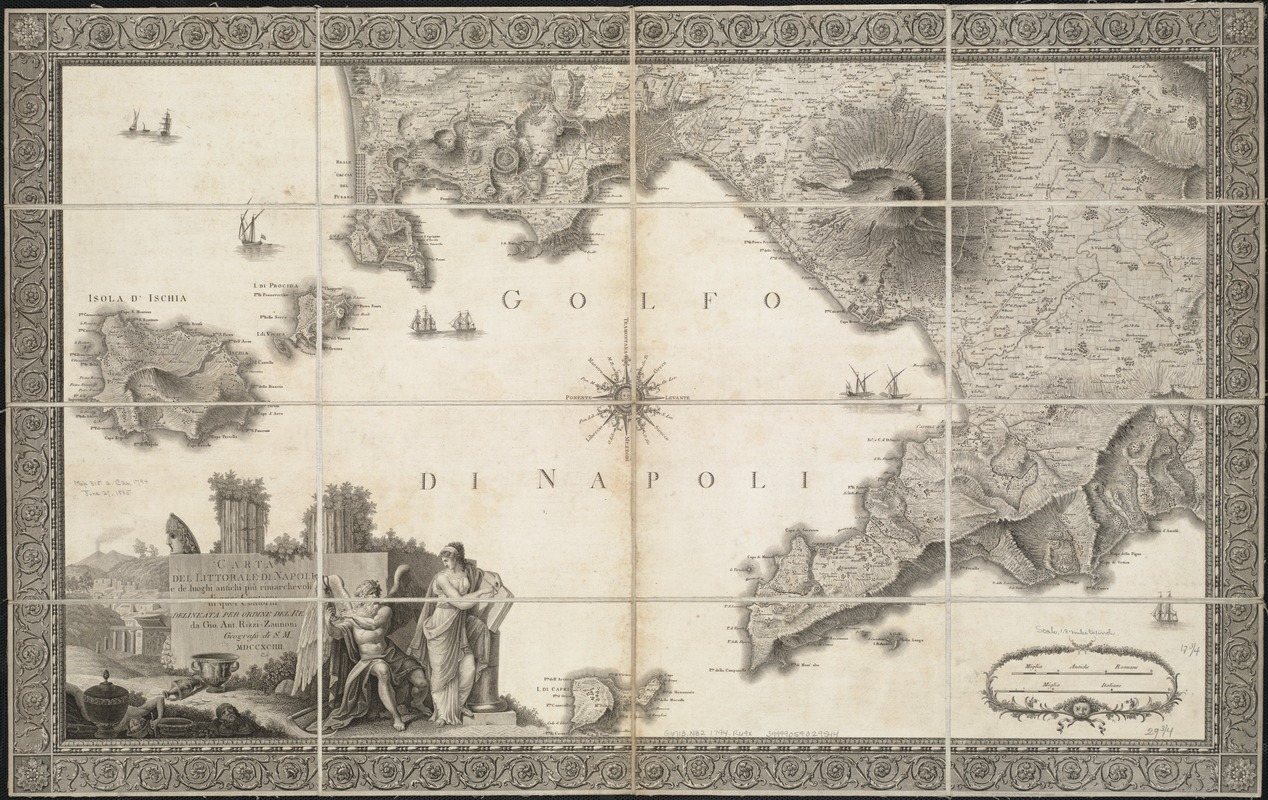
Giovanni Rizzi-Zannoni (1736-1814)
“Carta Del Littorale Di Napoli e de Luoghi Antichi più Rimarchevoli di quei Contorni”
[Naples], 1794.
Volcanoes have appeared on maps since the 15th century; however, the true makeup of these fascinating and devastating landforms was not fully appreciated until the 20th century. For many years and in numerous cultures, volcanoes were understood and explained as part of a mythology, as seen in this 1794 map illustrating the seismically-active land around Naples, Italy, where Mount Vesuvius features prominently. Vesuvius violently erupted in 79 CE, burying Pompeii and surrounding towns in up to 23 feet of ash, rock and volcanic debris. The cartouche in the lower-left corner of the map illustrates the volcano, along with the classical figures Thanatos, representing Death, and Clio, signifying personal character, presiding over Pompeii’s ruins.
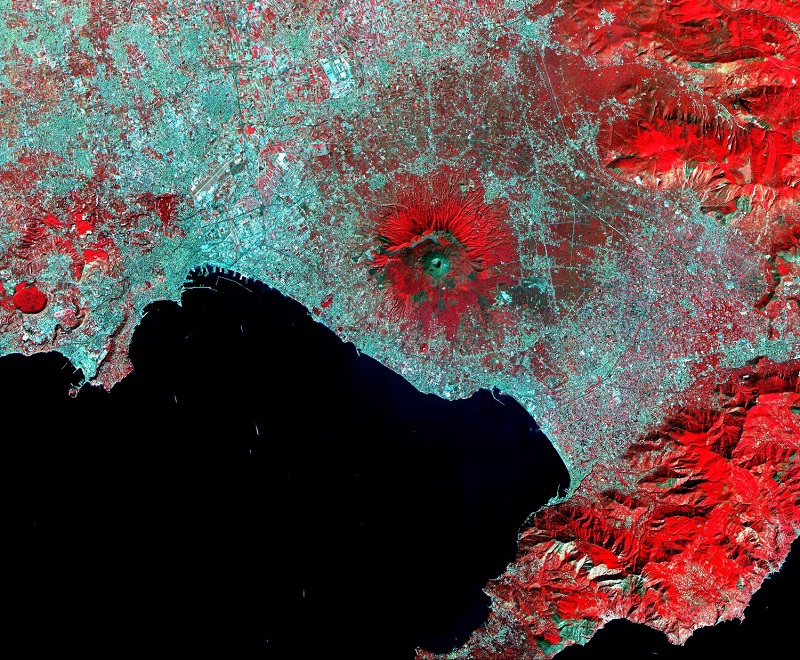
NASA/GSFC/MITI/ERSDAC/JAROS and U.S./Japan ASTER Science Team
“Mount Vesuvius, Italy”
2000. Reproduction, 2017.
Source: NASA Earth Observatory.
The city of Pompeii was discovered in the late-16th century. Excavations at the site detail what life was like in an ancient Greco-Roman town, as structures, objects, and remains of humans have been preserved in situ for over 1000 years. Nearly 20,000 inhabitants lived in the ancient city when the volcano erupted in 79 CE. This false-color “Advanced Spaceborne Thermal Emission and Reflection Radiometer (ASTER)” image made available by NASA shows Mount Vesuvius currently, with the city of Naples spreading out from all sides of the volcano. Today, more than 2 million people live near Vesuvius, which is constantly being monitored for activity.
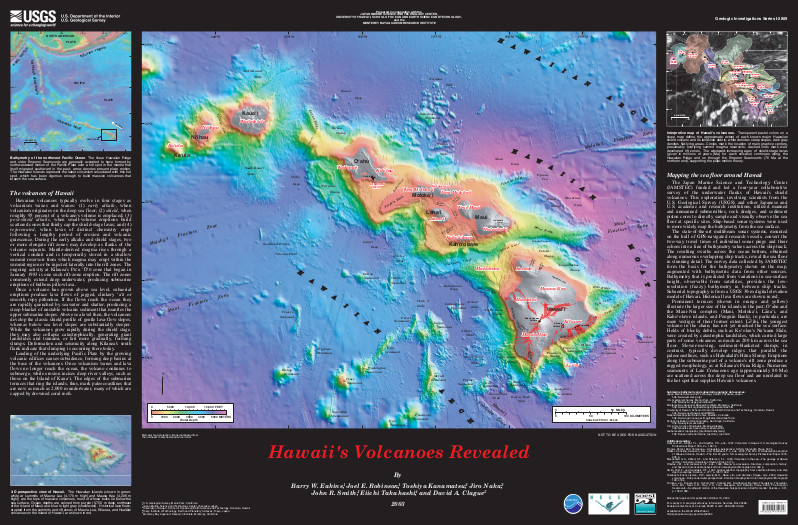
Barry W. Eakins, Joel E. Robinson, Toshiya Kanamatsu, Jiro Naka, John R. Smith, Eiichi Takahashi and David A. Clague
“Hawaii’s Volcanoes Revealed”
Reston, VA: U.S. Geological Survey, 2003. Reproduction, 2017.
Source: U.S. Geological Survey.
The Hawaiian Islands, illustrated above and below the ocean’s surface in this map, are an example of “hotspot” volcanoes, or volcanoes that occur on the interior of lithospheric plates, rather than at the edges. The older islands in the chain at the upper left of the map were once much larger, but as the earth’s plates move, volcanoes gradually become inactive and sink into the ocean when they are no longer over the magma source. In contrast, the younger “big island” of Hawaii in the lower right is currently sitting over the “hotspot,” and is home to two of the world’s most active volcanoes – Kīlauea and Mauna Loa.
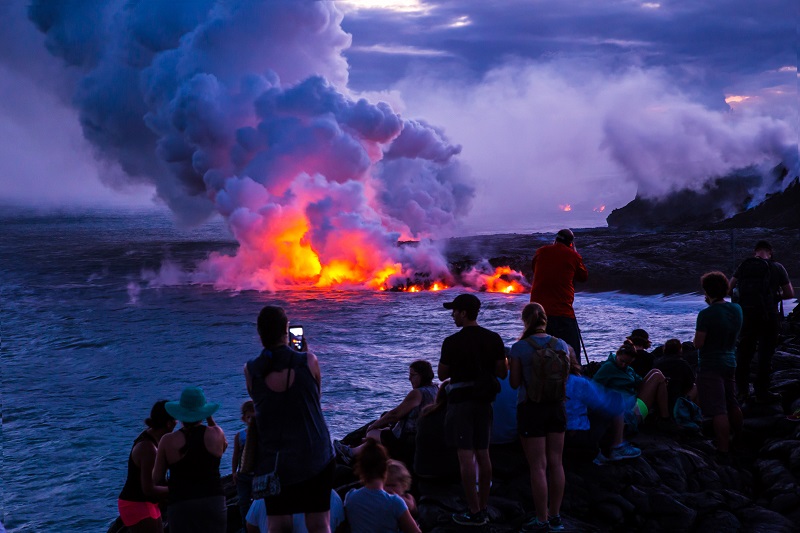
National Park Service / J. Wei
“Evening Shot of Ocean Entry: County Public Viewing Area on the Kalapana Side of the Lava Flow”
[Washington, D.C.: National Park Service, 2016]. Reproduction, 2017.
Source: National Park Service.
When lava flows reach the ocean, they produce steam and shatter as they cool, creating unstable land and volcanic sediment that falls to rest on the underwater slopes of the volcano. Kīlauea has erupted continuously since 1983, and its lava flows have added more than one mile of new land to the island. Kalapana was once a historic fishing village on the Big Island, but was slowly consumed by lava and fire from a 1990 eruption of Kīlauea. Now, the Kalapana site is used for viewing Kīlauea’s lava flows as they enter the sea, as displayed in this photograph.
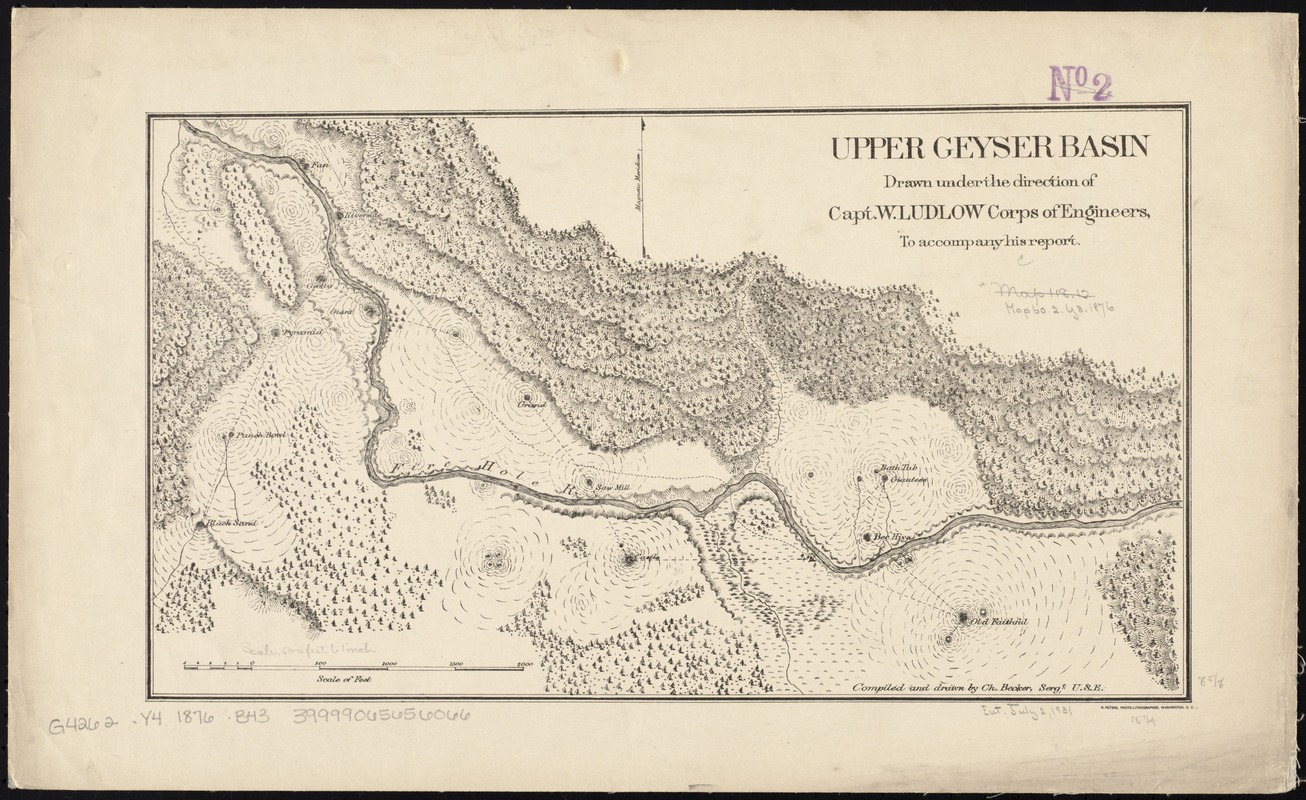
Charles Becker (fl. 1876)
“Upper Geyser Basin”
Washington, D.C.: Army Corps of Engineers, [1876]
Yellowstone National Park – the United States’ first such park – is also home to more than 10,000 hydrothermal features, including 300 geysers, which result from volcanic activity. They occur when magma or very hot rocks deep in the earth heat groundwater. A geyser’s spout of steam and hot water takes place when the pressure of the near-boiling underground water is released. The entire Yellowstone region is volcanically and seismically active, and is known as a “supervolcano.” This map illustrates Yellowstone’s Upper Geyser Basin – home to the famous Old Faithful geyser – just four years after the park was established.
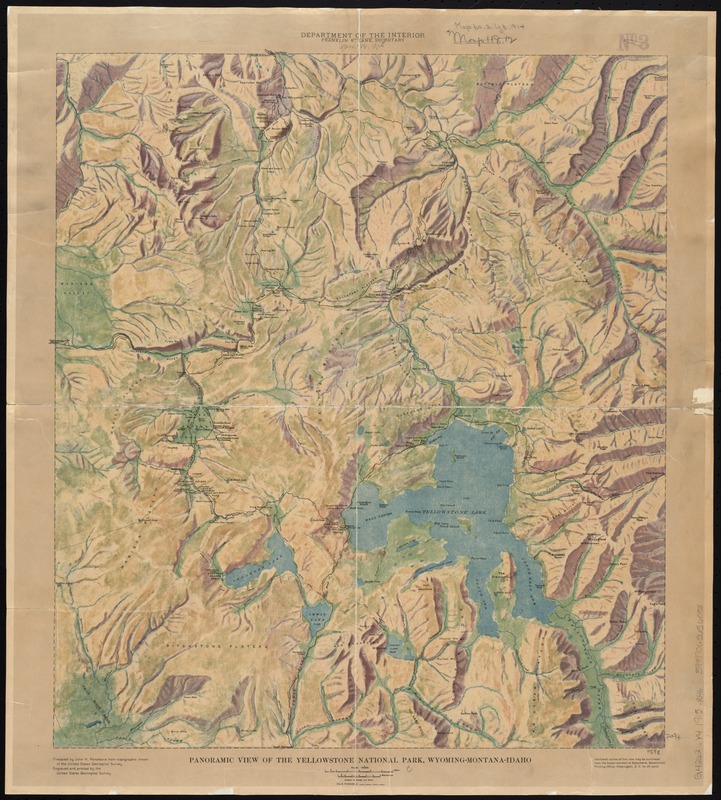
John H. Renshawe (1852-1934)
"Panoramic View of the Yellowstone National Park, Wyoming-Montana-Idaho”
Washington, D.C., 1914.
This shaded-relief map by John Renshawe of the U.S. Geological Survey illustrates the varied topography, or natural features, encompassed by Yellowstone National Park. Mountain ranges, lakes, rivers, and hydrothermal features such as steam vents, fumaroles, paint pots, mud cauldrons, geysers, hot springs and more make up this varied landscape. The Upper Geyser Basin, home to Old Faithful, is located west of Yellowstone Lake. Renshawe has applied color in a painterly style to indicate relief, making this map look more like a work of art than a typical topographic map which uses contour lines and minimal color to indicate relief.
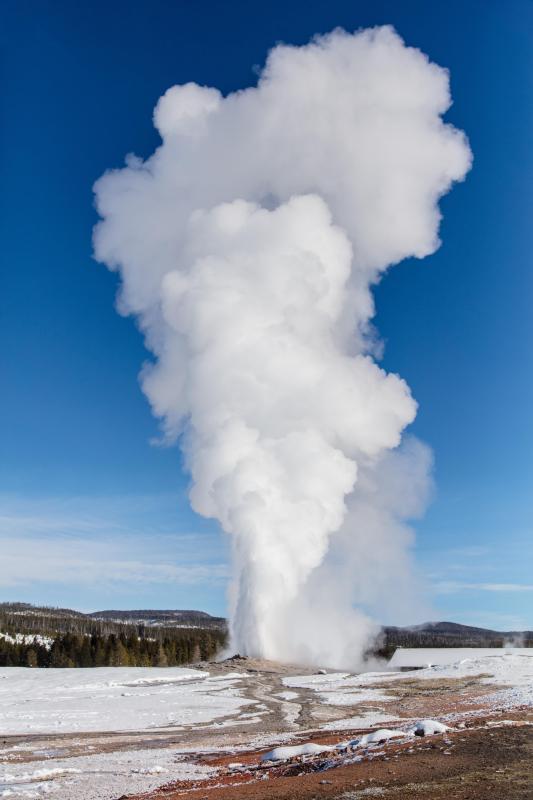
National Park Service / Jacob W. Frank
“Old Faithful Erupts on a Clear Winter Day”
[Washington, D.C.: National Park Service, 2016]. Reproduction, 2017.
Source: National Park Service, Yellowstone National Park
Old Faithful is pictured here as it exists in the Upper Geyser Basin of Yellowstone National Park. The geyser was named in 1870 as it was said to gush “faithfully” every 63 to 70 minutes, although current observations have Old Faithful averaging a 1 to 5 minute eruption every 90 minutes. Old Faithful is not Yellowstone’s largest geyser, but it is the most recurrent spout in the park.
2. Geology
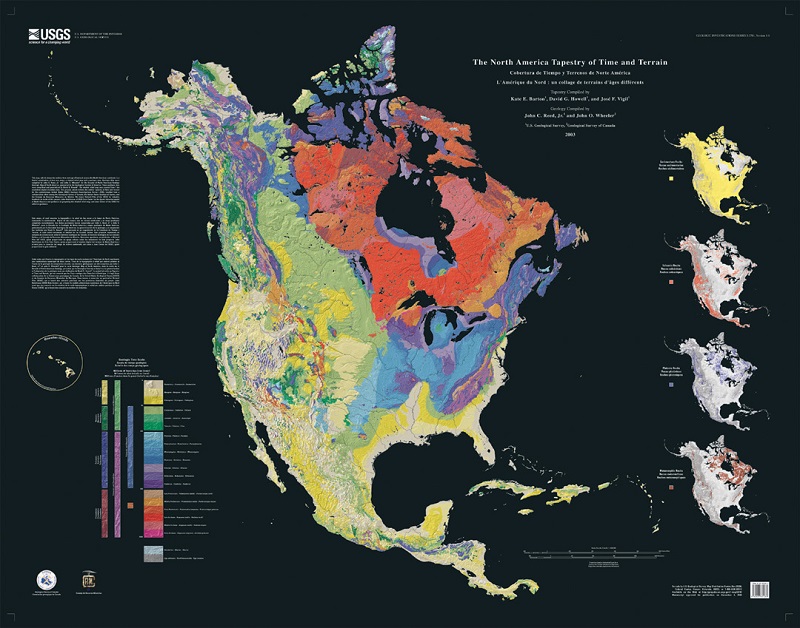
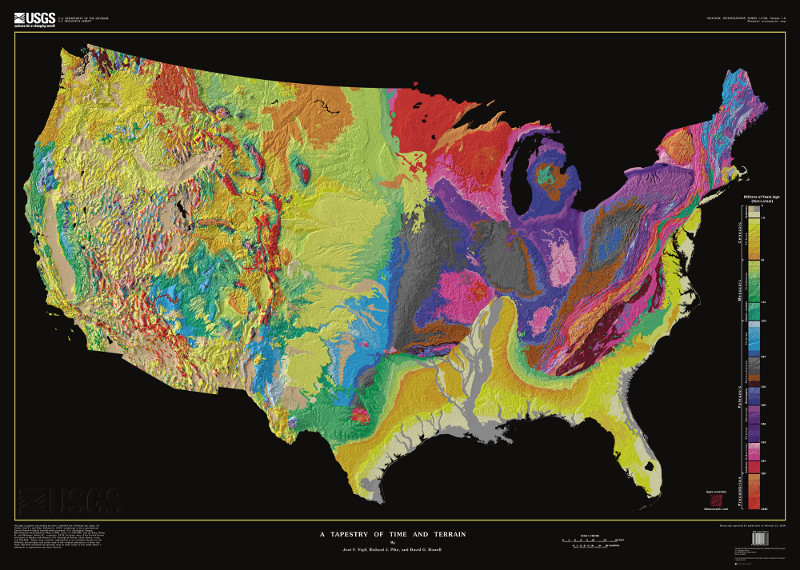
Kate E. Barton, David G. Howell, José F. Vigil
“The North American Tapestry of Time and Terrain: U.S. Geological Survey Geologic Investigations Series I-2781”
[Reston, VA]: U.S. Geological Survey, 2003. Reproduction, 2017.
Source: U.S. Geological Survey
Time and terrain are beautifully combined in this map, illustrating the complex dimensions and geology of North America. A shaded-relief image renders the topography of the continent in three dimensions (height, width and depth), and color represents a fourth dimension of geologic time. The end result is an extremely detailed map that illustrates rock type, landforms and geologic time all at once. The four smaller maps show the locations of the four major rock types: metamorphic, plutonic, sedimentary and volcanic. It was created by teams at the U.S. Geological Survey, the Geological Survey of Canada, and the Mexican Consejo Recursos de Minerales.
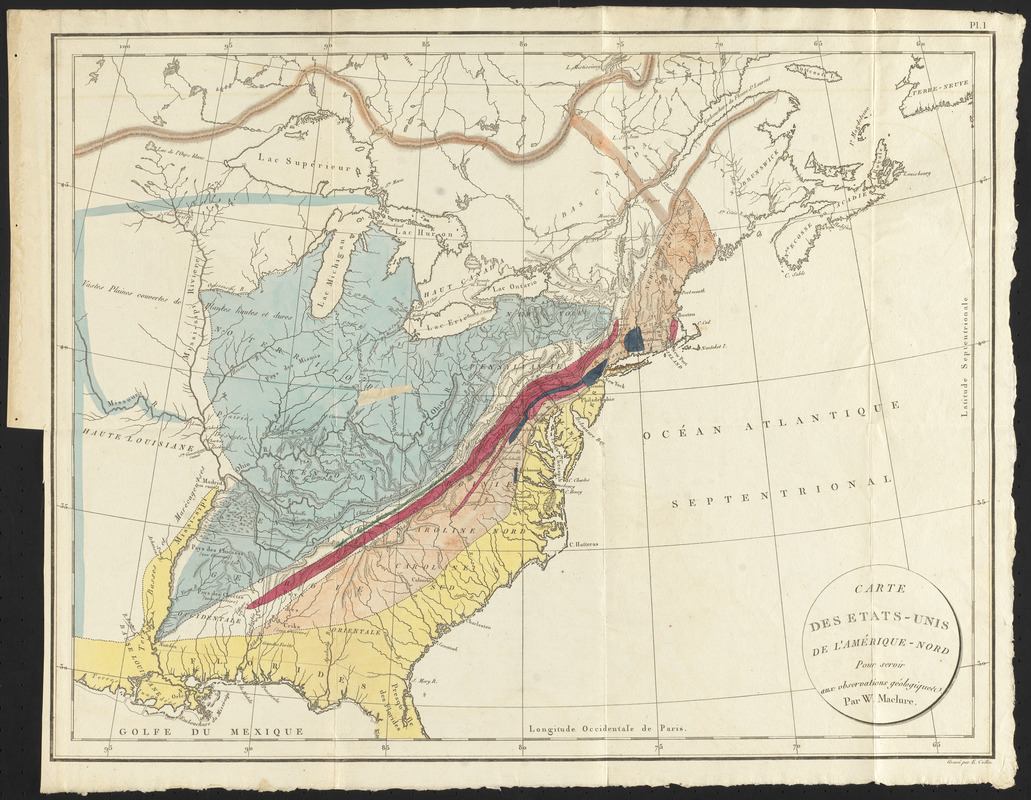
William Maclure (1763-1840)
“Carte des Etats-Unis de L’Amérique-Nord”
[Paris, 1811]
Geologic maps originated in Europe during the first half of the 18th century, but it wasn’t until the 19th century that they were more frequently produced. American geologists, following European advancements, were also producing maps. William Maclure ̶ Scottish-born but based in the United States ̶ was a pioneer in the field of American geology. His first map on the subject was issued in 1809. The 1811 French edition of the map is displayed here. Using color, Maclure indicates different rock units according to their ages over large swaths of the country, although the map lacks a legend and specific details.
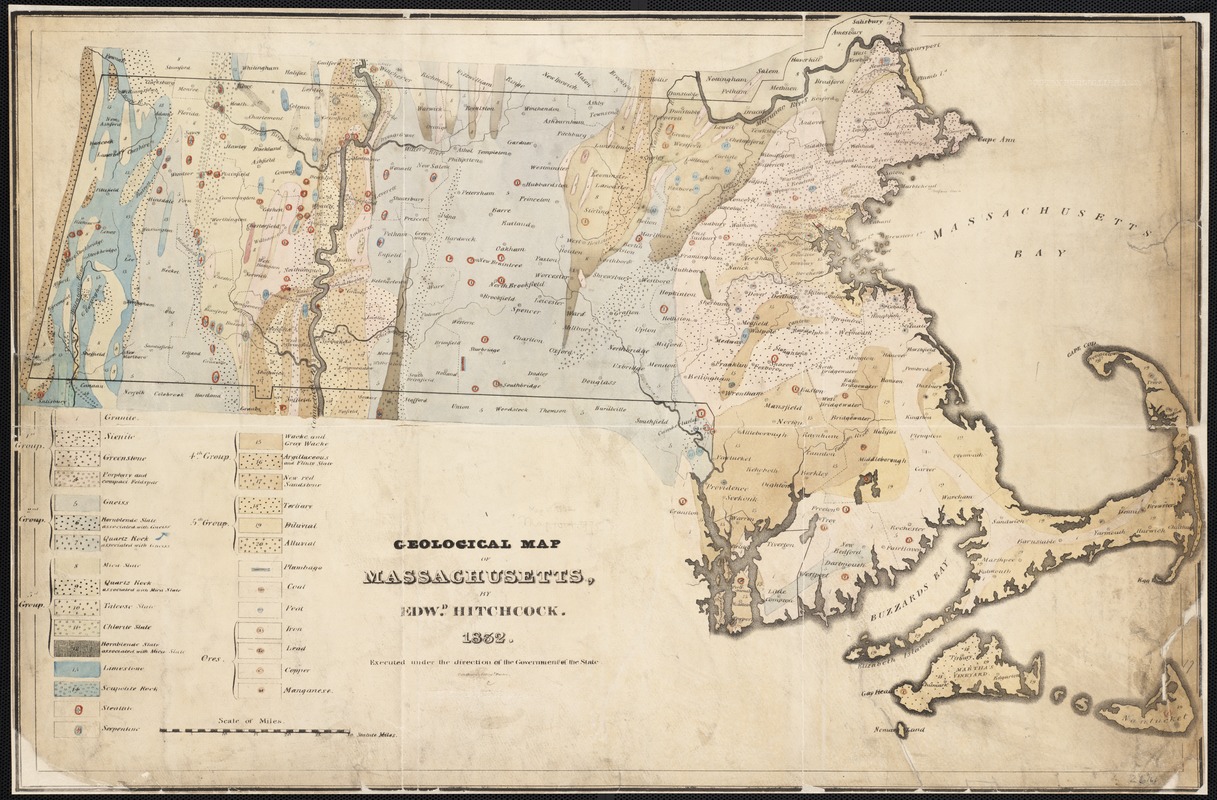
Edward Hitchcock (1793-1864)
“Geological Map of Massachusetts”
New Haven, CT, 1832.
By the 1830s and 1840s, numerous eastern states throughout the country had established formal geological surveys to investigate their mineral resources. Edward Hitchcock became Massachusetts’ first state geologist in 1830, and two years later produced this map while serving in that role. Hitchcock not only used color to differentiate between rock formations and minerals, but also used symbols within major rock groups to illustrate finer levels of detail. Hitchcock taught natural sciences at Amherst College, and focused much of his research on the Connecticut River Valley, as evidenced by the thorough execution of geologic information in that area on the map.
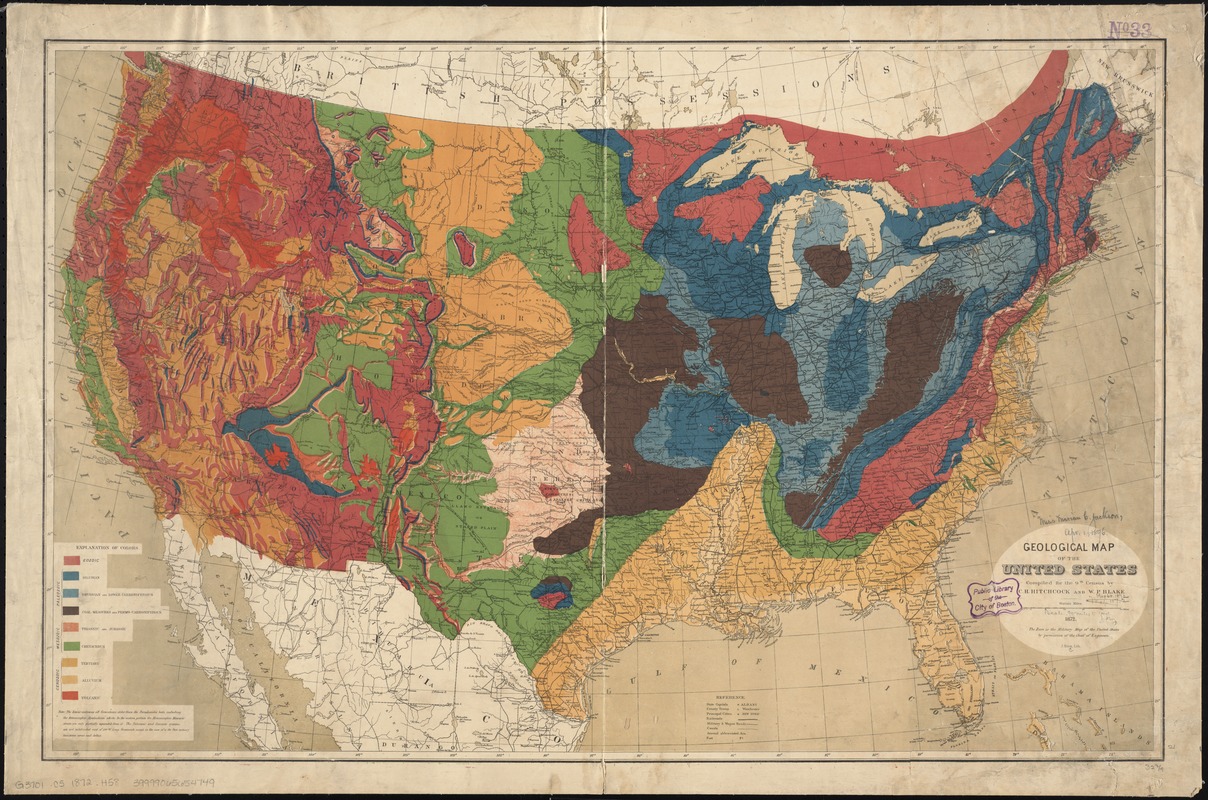
Charles H. Hitchcock (1836-1919) and William P. Blake (1826-1910)
“Geological Map of the United States”
Washington, D.C., 1872.
The Hitchcock family’s interest in geology passed from Edward to his son Charles, who by 1861 was appointed the State Geologist in Maine, and later in the decade State Geologist in New Hampshire. Geologic mapping of the area west of the Mississippi River grew rapidly after the Civil War, and the 1872 map displayed here by Hitchcock and William Blake is an example of that effort. Prepared for the 1870 statistical atlas of the United States, this map represents a transition from earlier 19th-century examples, as it uses highly detailed placement of vivid colors to differentiate between geologic time periods, and examines the fossils contained within the rocks.
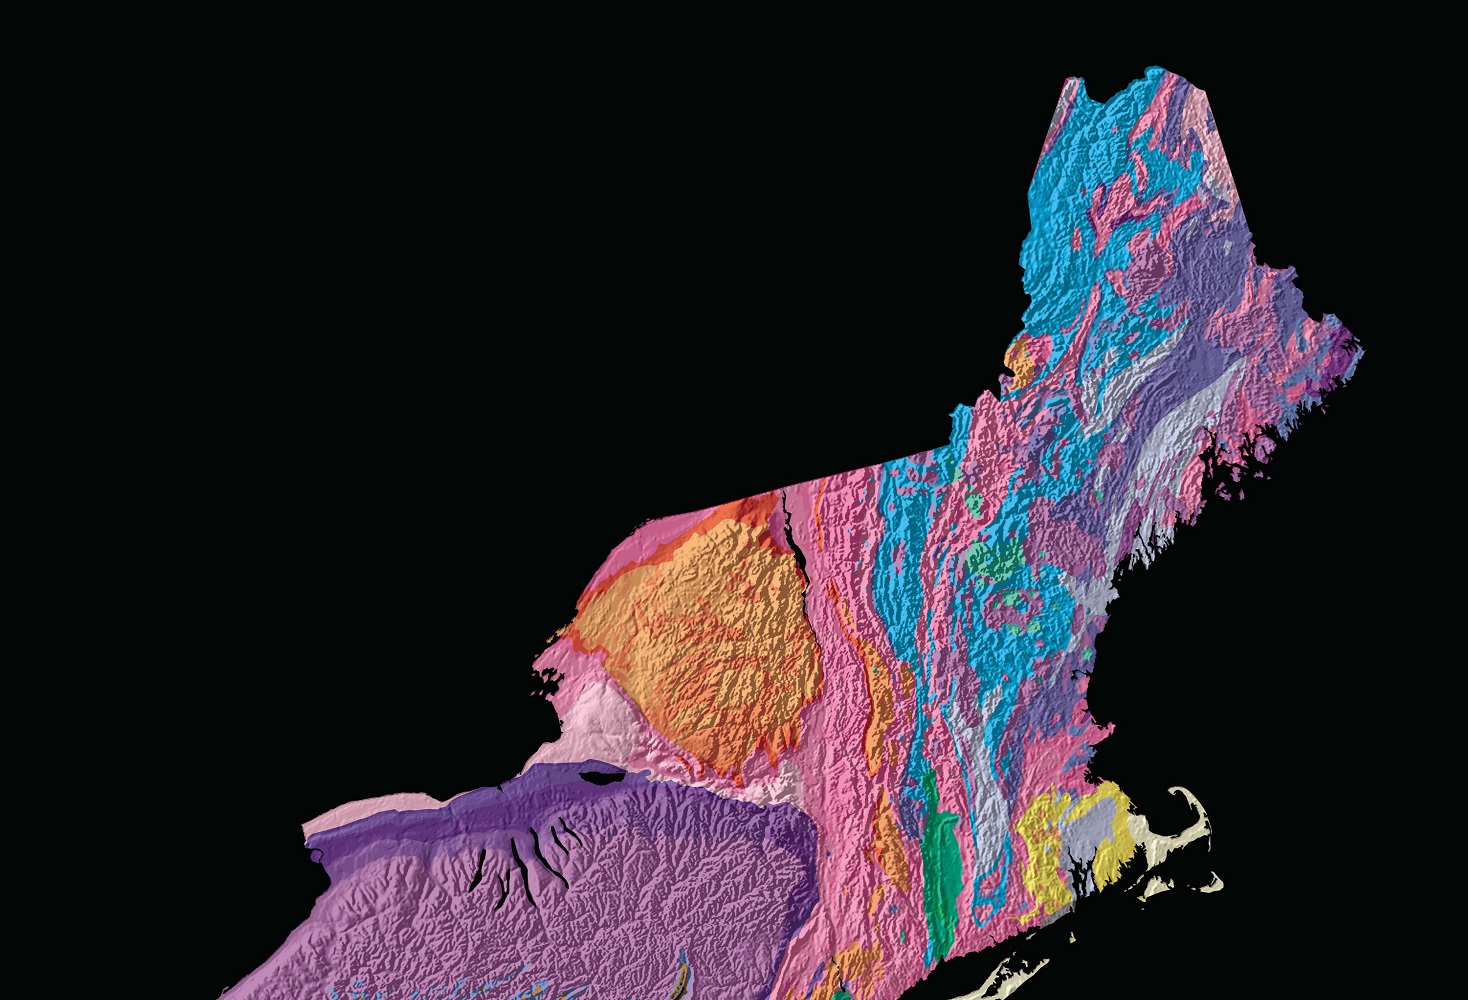
José F. Vigil, Richard J. Pike and David G. Howell
“A Tapestry of Time and Terrain: U.S. Geological Survey Geologic Investigations Series 2720” (left) and “[Detail]” (right)
Denver, CO: U.S. Geological Survey Information Services, 2000. Reproductions, 2017.
Source: U.S. Geological Survey
Current geologic maps of the United States are created using computers for processing vast amounts of information and enhancing imagery. The map displayed here is an example of the stunning results generated by digital cartography, and was created by combining topography and geology. A gray-scale digital shaded-relief image illustrates the terrain, while color is used to represent geologic time, resulting in a map that tells the landscapes’ story of how it was formed over the last 2.6 billion years. The detail on the right shows the complex geology and varied terrain in the New England region.
3. Oceans
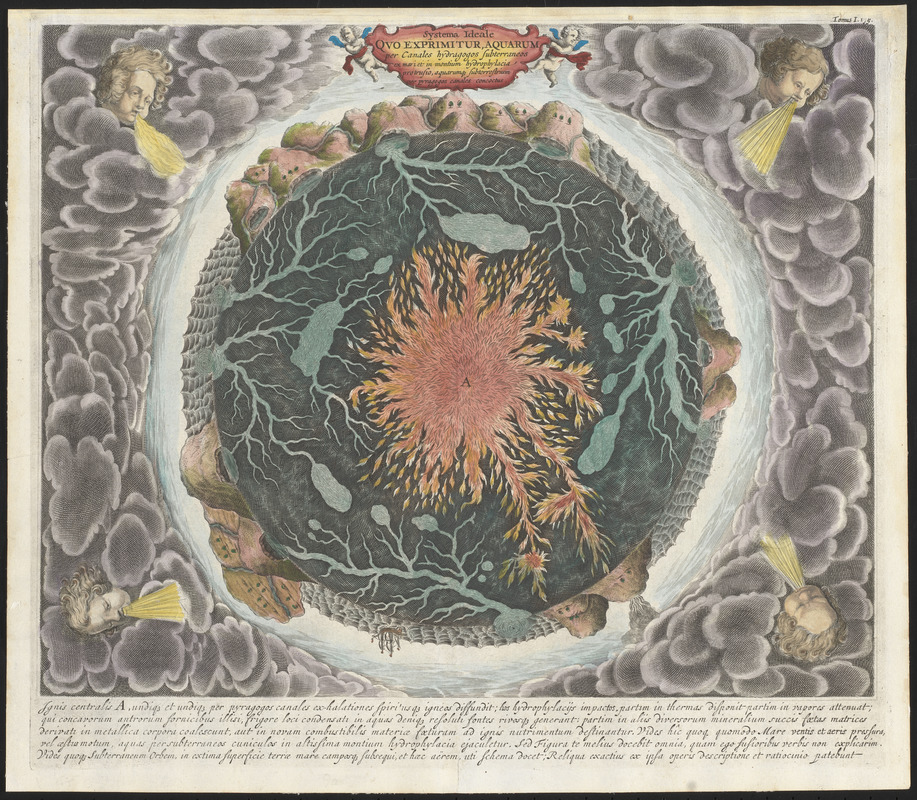
Athanasius Kircher (1602-1680)
“Systema Ideale quo Exprimitur, Aquarum per Canales Hydragogos Subterraneos ex Mari et in Montium Hydrophylacia Protrusio, Aquarumq. Subterrestrium per Pyragogos Canales Concoctus,” from “Mundus Subterraneus”
Amsterdam, ca. 1665.
Created by Jesuit priest and scholar Athanasius Kircher, this intriguing map of the earth was included in his 1665 treatise “Mundus Subterraneus.” Kircher’s early theories combined religion and science, and looked to Scripture for evidence in Earth’s formation. This map depicts all bodies of water on Earth connected by a system of underground waterways. Oceanic whirlpools feed these channels, while mountain springs derive water from these resources, creating a cycle of water above and below ground. Kircher also placed a large ball of fire in the center of the earth, suggesting that this inferno causes lava and water to rise from Earth’s interior.
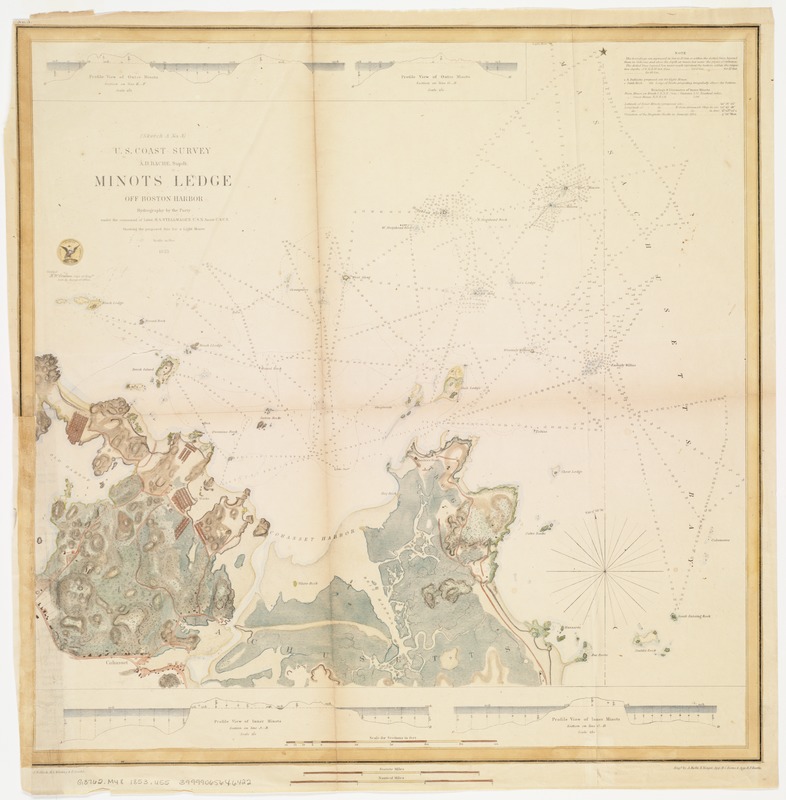
U.S. Coast Survey
“Minots Ledge off Boston Harbor: Showing the Proposed Site of a Light House”
Washington, D.C., 1853.
Mapping of the features beneath the ocean’s surface began in Europe in the late-16th century, with cartographers using simple symbols such as soundings (numbers that indicate depth in fathoms) and stippling (small dots) to illustrate shallow banks or ledges. The United States established the Coast Survey in 1807 with a mission to map the coastal waters of the nation. The chart of Minot’s Ledge in Massachusetts Bay displayed here was produced by the Coast Survey during its first fifty years, to plan for a lighthouse. The chart displays a number of soundings and profiles, and illustrates sunken rocks, ledges, and the sea floor using a variety of symbols.
4. Mining
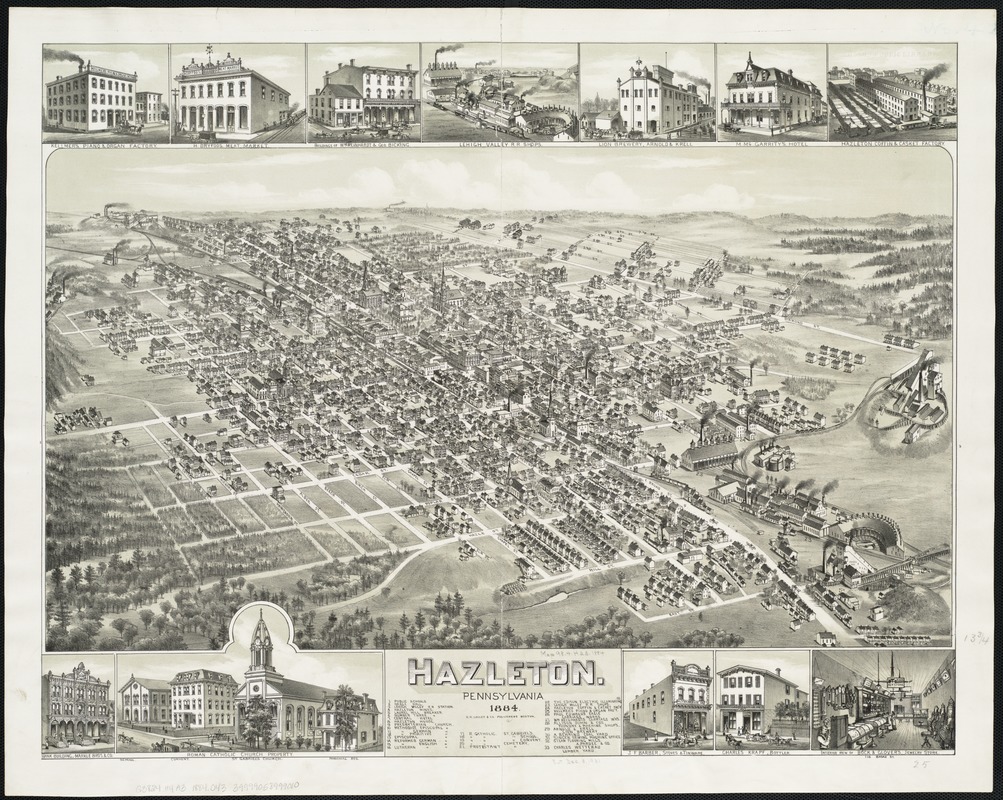
O.H. Bailey & Co.
“Hazleton, Pennsylvania”
Boston, 1884.
Anthracite, or “hard coal” has been mined in northeast Pennsylvania since the early 19th-century. By mid-century, this valuable resource that could burn longer and more efficiently than softer coal mined elsewhere in Pennsylvania, was heavily unearthed and sent to cities on the east coast. Towns such as Hazleton, illustrated here in this bird’s-eye view, grew up around anthracite mining activities, and by the 1880s was home to a large immigrant population from Eastern Europe who worked in the mines, as well as wealthy mine owners. “Hazleton Mines” is pictured in the upper left of the view, and two breakers, or processing plants, are situated on rail lines in the lower right.
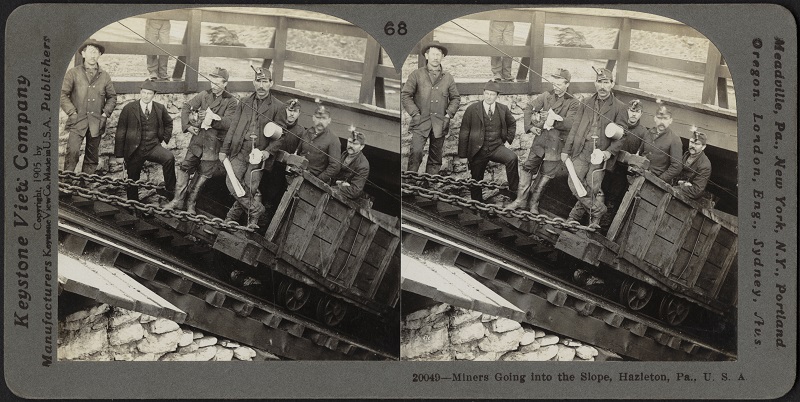
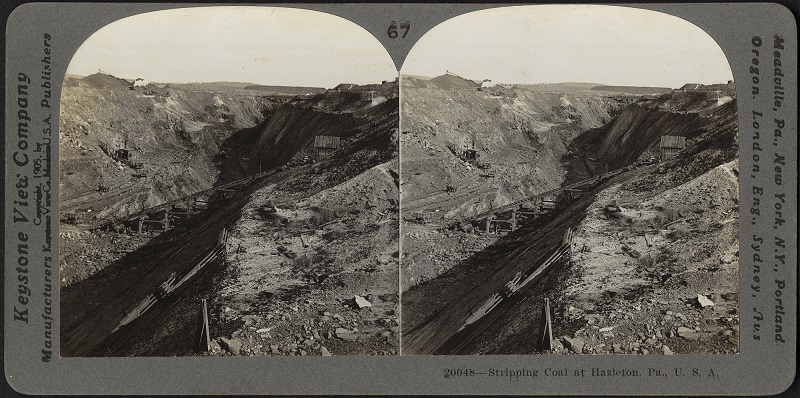
Keystone View Company
“Stripping Coal at Hazleton, Pa.” (left) and “Miners Going Into the Slope, Hazleton, Pennsylvania” (right)
Meadville, PA, c1905.
Courtesy Boston Public Library, Print Dept.
While 19th-century bird’s-eye views like the Hazleton, Pennsylvania example were produced to promote the prosperity of towns throughout the country, the realism of photography tells another story of those who lived in this mining town. The left stereo-pair pictures workers on a cart descending into the mine, while the right stereo-pair depicts a strip mining facility in Hazleton from 1906. These workers – along with children – many of whom were European immigrants, worked long days in dangerous conditions below ground, and faced discrimination and poor living conditions once on the surface. Despite these hardships, the miners worked with pride and eventually laws regulating safety practices were established.
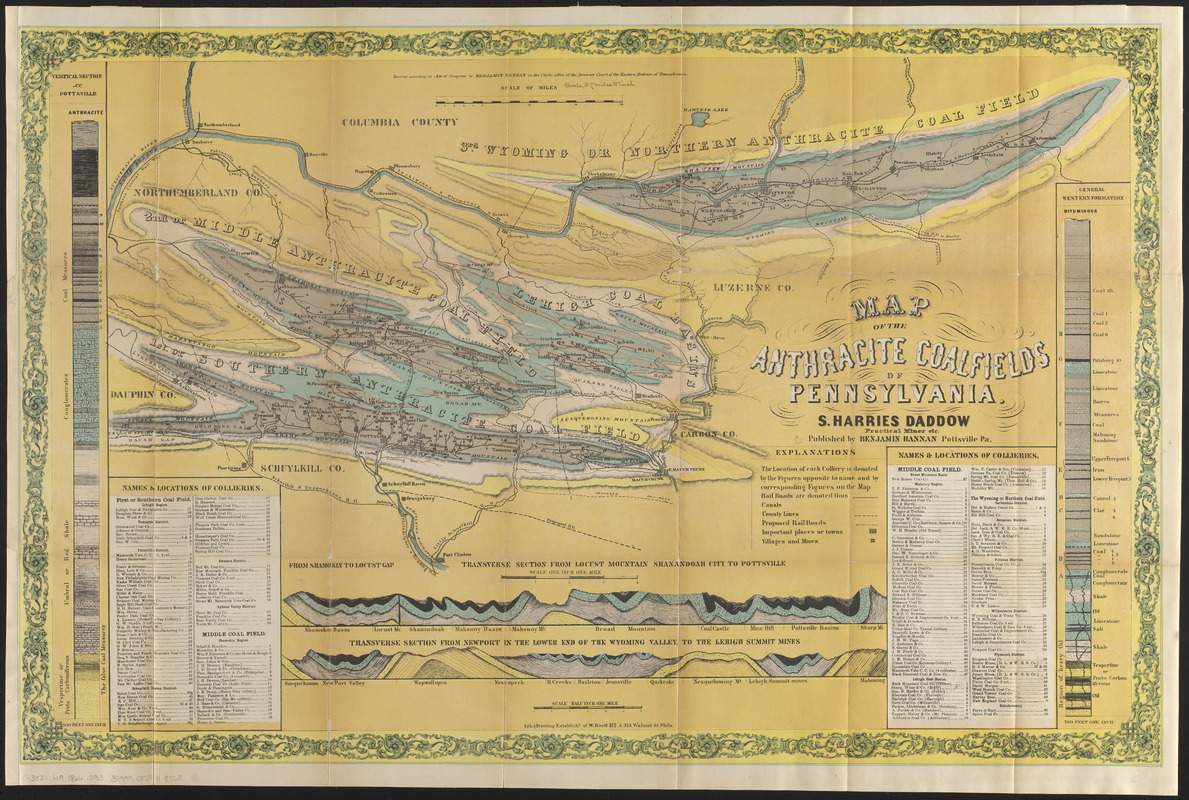
Samuel Harries Daddow (1827-1875)
“Map of the Anthracite Coalfields of Pennsylvania”
Pottsville, PA, [ca. 1886]
The second half of the 19th century was the peak of anthracite coal mining in Pennsylvania. This 1886 map illustrates the geology of the region, and uses two modern techniques to visualize minerals below ground. A columnar vertical section, seen here along the left edge of the map, represents the makeup of the earth’s crust at a specific place, in this case, Pottsville, Pennsylvania. A transverse view, or, cross section, illustrated along the bottom of the map, shows rock formations between two geographic locations. These visual aids first appeared on maps in the early-19th century, when mapmakers attempted to illustrate Earth’s substructures.
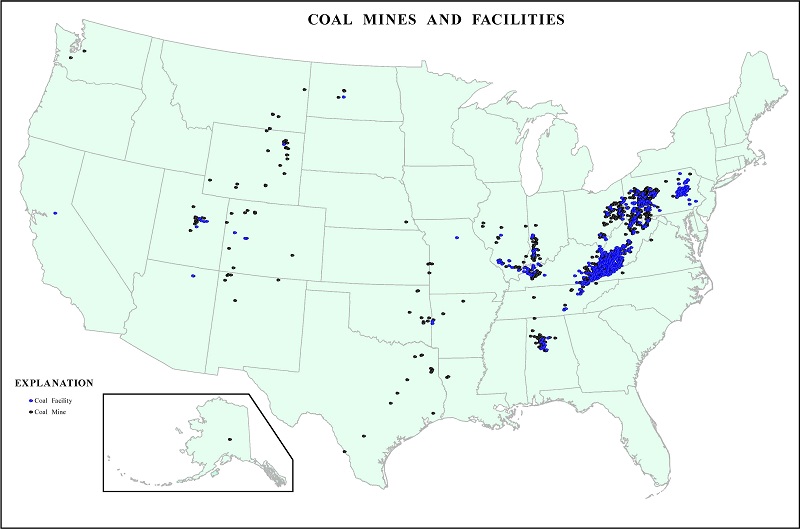
Deborah A. Kramer, John F. Papp, Nicole M. LaTurno & Joseph Gambogi
“Coal Mines and Facilities”
[Reston, VA]: U.S. Geological Survey, 2000. Reproduction, 2017.
Source: U.S. Geological Survey
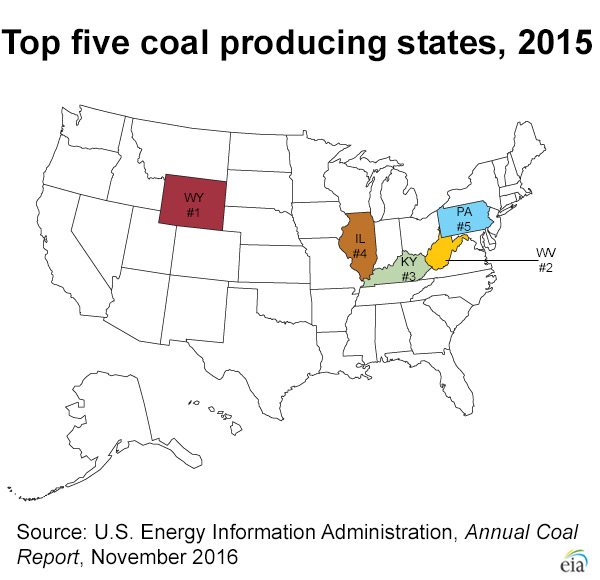
U.S. Energy Information Administration
“Top Five Coal Producing States, 2015,” from “Annual Coal Report, November 2016”
Washington, D.C., 2016. Reproduction, 2017.
Source: U.S. Energy Information Administration
In Pennsylvania’s anthracite coal country, underground mine mapping became law by the late- 19th century, although the practice was not observed by all mining operations. With these new regulations, increased worker safety and engineering knowledge was the goal. Today, underground maps are produced for coal facilities throughout the country. The map above shows locations of coal mines and plants as of 1997, with nearly 1,400 active operations, while the map below illustrates the top five coal producing states in the United States. As of 2016, Pennsylvania ranks fifth in the nation for coal production.
5. Oil and Natural Gas
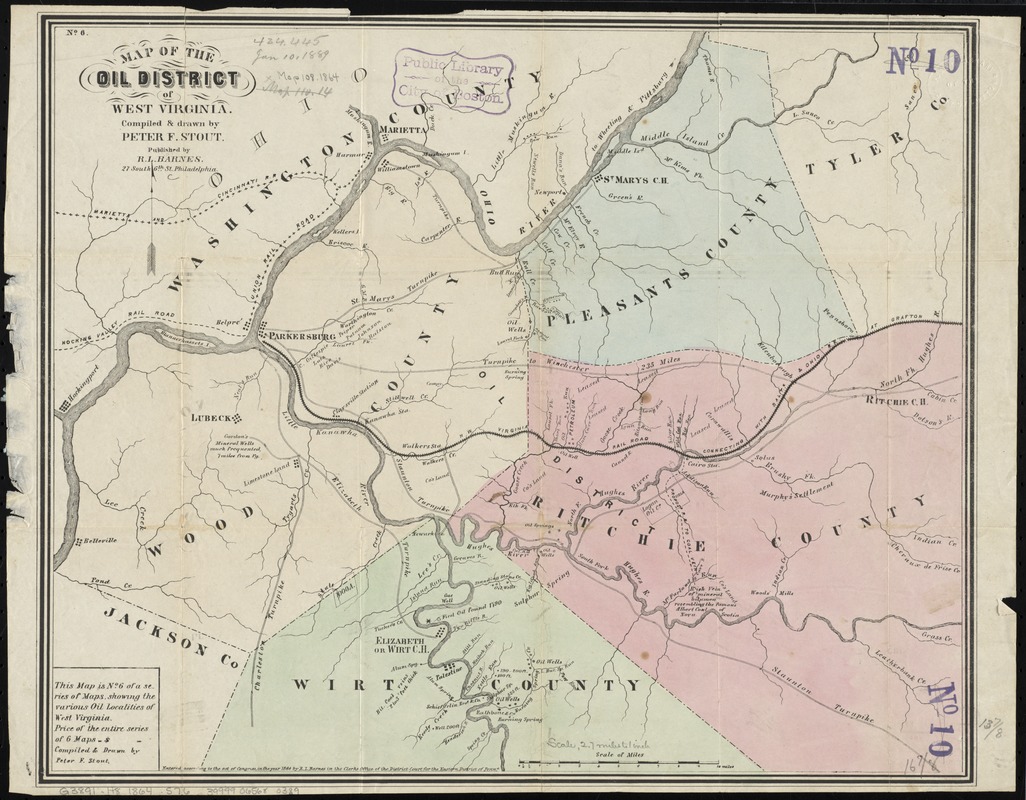
Peter F. Stout (fl. 1864-65)
“Map of the Oil District of West Virginia”
Philadelphia, 1864.
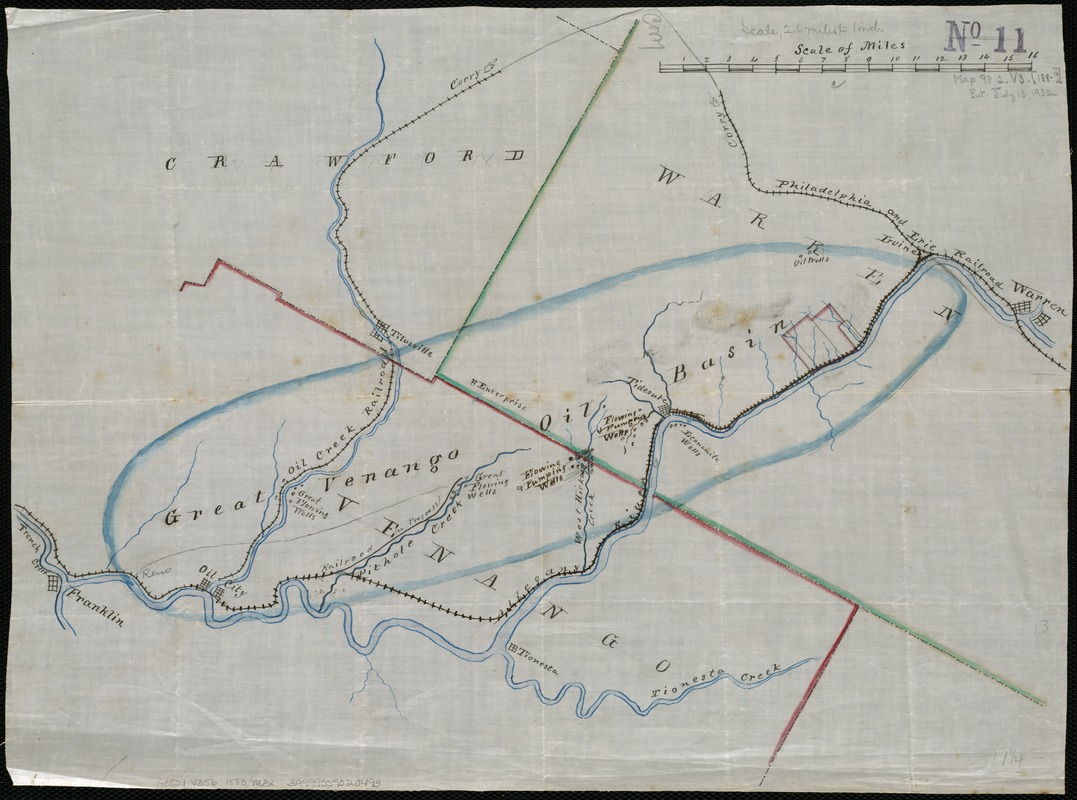
[Map of the Great Venango Oil Basin]
[1880-1890?]
Although West Virginia is the second state in the country for coal production, crude oil has also been drilled for since the mid-19th century. The top map, produced during the Civil War, shows the “oil district” of West Virginia, and includes locations of oil and gas wells, as well as coal seams. The map has a note stating “first oil found 1790,” in a location just north of present-day Elizabeth in Wirt County. The late-19th-century hand-drawn map below illustrates Pennsylvania’s Venango County oil basin, and shows locations of wells throughout three counties in the northwestern part of the state.
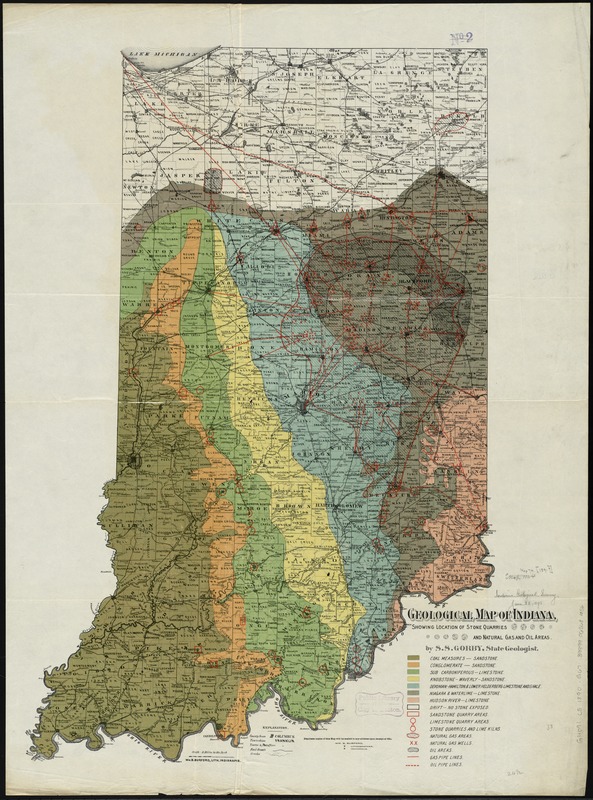
S.S. Gorby (fl. 1890-1900?)
“Geological Map of Indiana, Showing Location of Stone Quarries and Natural Gas and Oil Areas”
Indianapolis, IN, [1890-1899?]
Geological maps could also be used to indicate location of oil and gas deposits, as seen by this late-19th-century example. This map of Indiana shows not only where coal and other industrial minerals are located, but also indicates sites of oil and natural gas basins and wells, and the pipeline systems in which to transport those resources. As was the case in West Virginia, oil and gas were first discovered in Indiana in the mid-19th century during salt mining operations. The area produced millions of barrels of oil until the early-20th century.
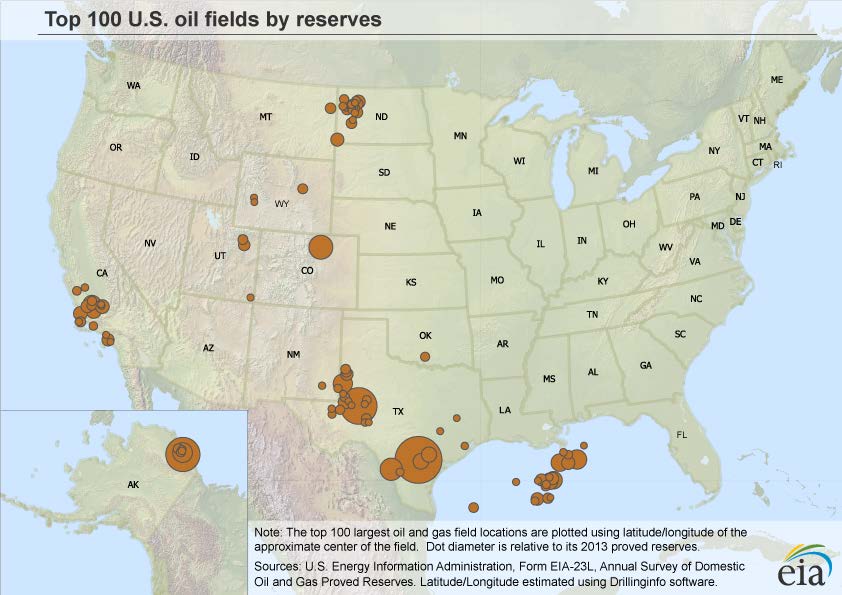
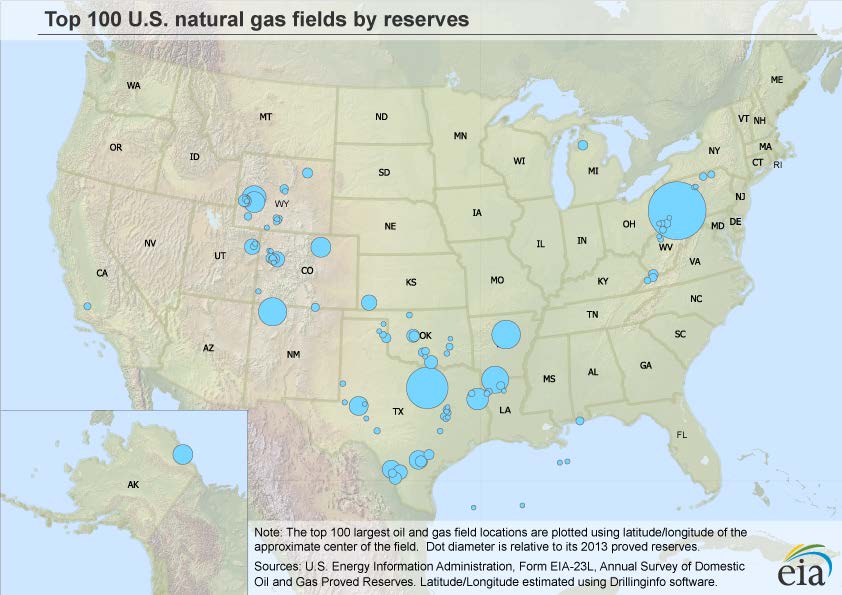
U.S. Energy Information Administration
“Top 100 U.S. Oil Fields by Reserves” and “Top 100 U.S. Natural Gas Fields by Reserves” from “Form EIA-23L, Annual Survey of Domestic Oil and Gas Proved Reserves”
[Washington, D.C., 2013], Reproductions, 2017.
Source: U.S. Energy Information Administration
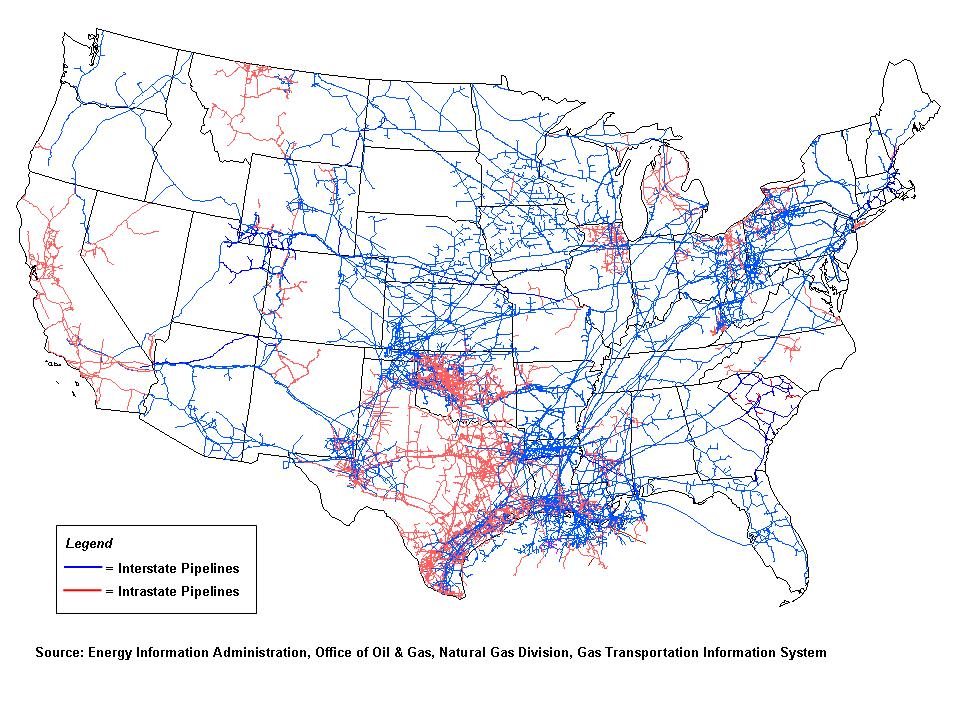

U.S. Energy Information Administration
“U.S. Natural Gas Pipeline Network, 2009” and “U.S. Lower 48 Underground Natural Gas Storage Facilities, By Type (December 31, 2010)”
[Washington, D.C., 2009 and 2010], Reproductions, 2017.
Source: U.S. Energy Information Administration
The four modern maps displayed here illustrate the location of oil and gas reserves, along with natural gas transmission pipelines and underground storage facilities. Crude oil is most heavily drilled in Texas, North Dakota and offshore in the Gulf of Mexico, while natural gas has a large presence in the Appalachian Basin in the east. Natural gas pipelines, both within state boundaries and throughout the country, are illustrated in the third map, whereas underground storage facilities are listed in the fourth map. Although each map uses different symbols to visualize information, these maps point out that these energy resources come from specific regions throughout the United States.
6. Dig Deeper: Energy
Thematic maps are important tools that help us visualize information as it relates to geography. When thematic maps on the same subject are viewed over time, they facilitate our understanding of patterns and relationships between phenomena and geographic locations, such as population trends in a city, or occurrences of weather events in a particular area. The thematic maps on display in these cases relate to current controversies in the United States: “fracking,” surface coal mining, the Dakota Access Pipeline and the Flint, Michigan water crisis. We invite you to use the maps and illustrations as tools to visualize these issues and their relationships to the physical, financial and communal impact on humans and our shared natural environment.
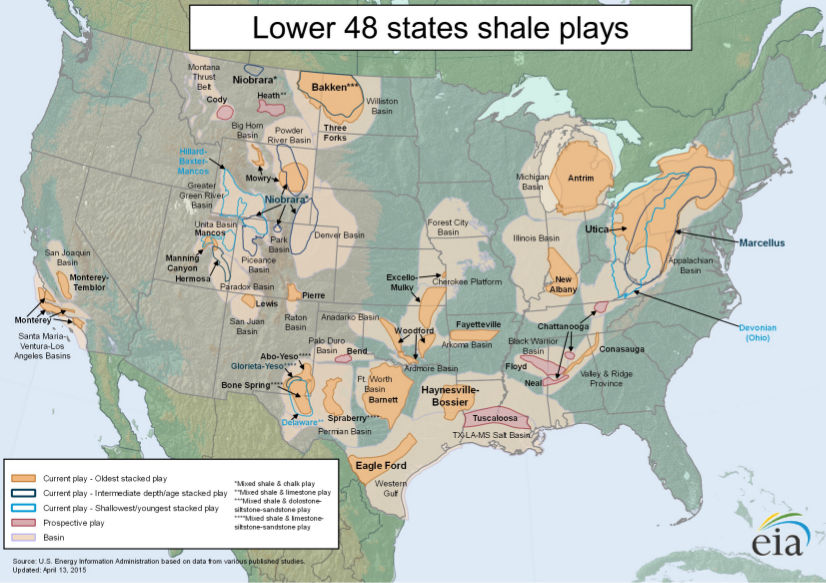
U.S. Energy Information Administration
“Lower 48 States Shale Plays,” 2016
[Washington, D.C.], Reproductions, 2017.
Source: U.S. Energy Information Administration.
The map displayed here illustrates shale plays throughout the lower 48 states. Shale plays are geologic areas where natural gas has been discovered or is thought to exist. The plays are located within basins that may also contain other natural resources, such as oil. As seen in this map, shale plays exist in distinct regions throughout the country, due to their specific geologic composition. Natural gas is removed from shale rock formations that date from the Paleozoic Era – roughly 542 to 251 million years ago.
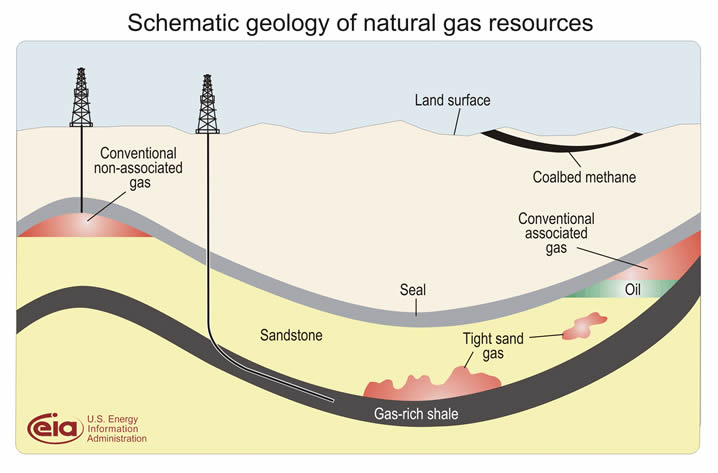
U.S. Energy Information Administration
“Schematic Geology of Natural Gas Resources”
[Washington, D.C.], 2010. Reproduction, 2017.
Source: U.S. Energy Information Administration.
Natural gas is extracted from shale plays by a process called hydraulic fracturing, more commonly known as “fracking.” Water, sand and chemicals are pumped into wells under high pressure to break up or fracture shale, which releases natural gas. The illustration displayed here explains the conventional, vertical well method of extracting natural gas, and the unconventional, more recent method of extracting natural gas in shale via horizontal drilling and hydraulic fracturing. Coalbed methane and tight sand gas are two additional resources that do not flow naturally into wells, so they too must be extracted using invasive techniques.
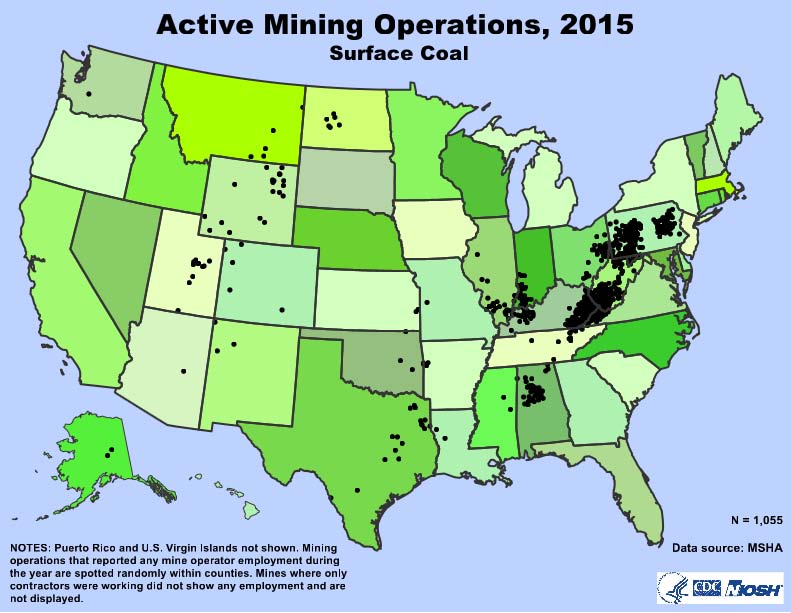
Centers for Disease Control, National Institute for Occupational Safety and Health, Mining Program
“Active Mining Operations, 2015: Surface Coal”
[Atlanta, GA, 2015]. Reproduction, 2017.
Source: Centers for Disease Control, National Institute for Occupational Safety and Health, Mining Program
Mining near the surface dates back to the Paleolithic Era; however, surface coal mining, also known as “strip mining” is a more recent development in coal extraction. Produced by the Centers for Disease Control and Prevention, this map illustrates the locations of the 1,055 surface coal mining operations throughout the United States in 2015. Surface mining accounted for over 72% of all coal extraction operations at the time. The states of Pennsylvania, Kentucky and West Virginia were home to nearly 70% of all active mines. The Mine Safety and Health Administration (MSHA), an organization that “enforces safety and health rules for all U.S. mines” provided data for the map.
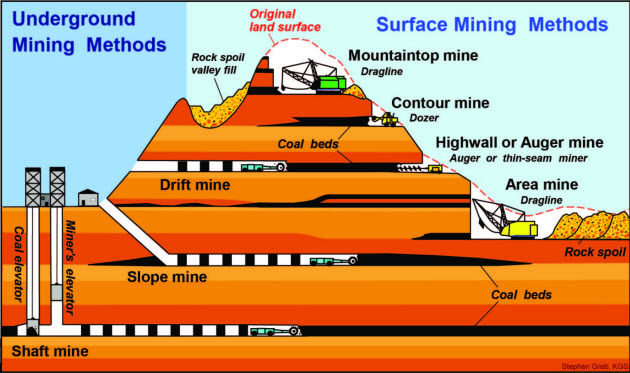
U.S. Environmental Protection Agency
“Underground and Surface Mining Methods”
[Washington, D.C., 2016]. Reproduction, 2017.
Source: U.S. Environmental Protection Agency.
The modern process of surface coal mining – illustrated here – began in the United States in the 1860s. In surface coal mining, tops or sides of mountains are removed, along with all vegetation. Drills and explosives are used to expose buried seams of coal. The excess rubble and soil created from this process is deposited into valleys or streams, or made into hills, and the mined areas are then required by law to be reclaimed, or, restored to their previous natural environmental state. Once the mountain’s prior topography has been rebuilt, vegetation has been established, drainage networks restored and erosion mitigated, the disturbed land is deemed reclaimed.
7. Dig Deeper: Water
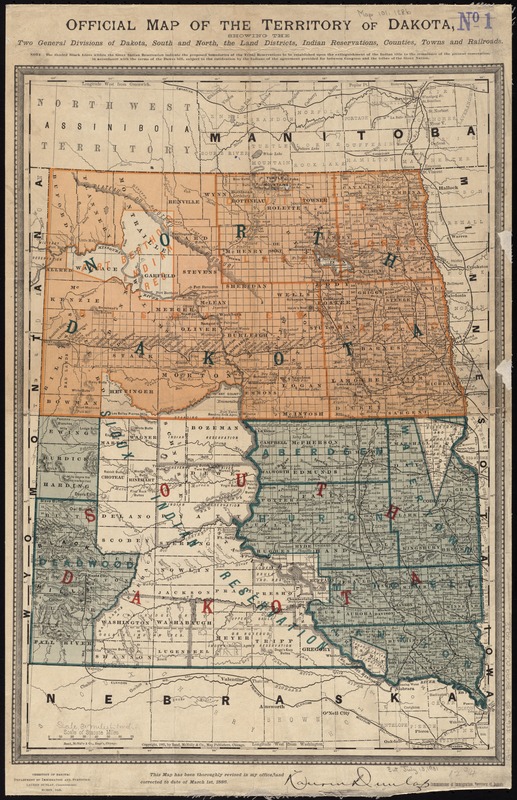
Dakota Territory. Department of Immigration and Statistics.
“Official Map of the Territory of Dakota, Showing the Two General Divisions of Dakota, South and North, the Land Districts, Indian Reservations, Counties, Towns and Railroads”
Chicago, 1886. Reproduction, 2017.
The original Great Sioux Reservation was established as part of the Fort Laramie Treaty of April 29, 1868, and initially comprised all of South Dakota west of the Missouri River. The map displayed here illustrates the extent of the reservation in 1886, after the sacred Black Hills were taken from the Great Sioux Reservation, which the U.S. Supreme Court deemed “unfair and dishonorable” in 1980. The Black Hills were appropriated by the United States government due to an abundance of mineral resources – mainly gold and silver – found there. As tribal lands were continually reduced, they were separated into six smaller reservations, including the Standing Rock Sioux Reservation.
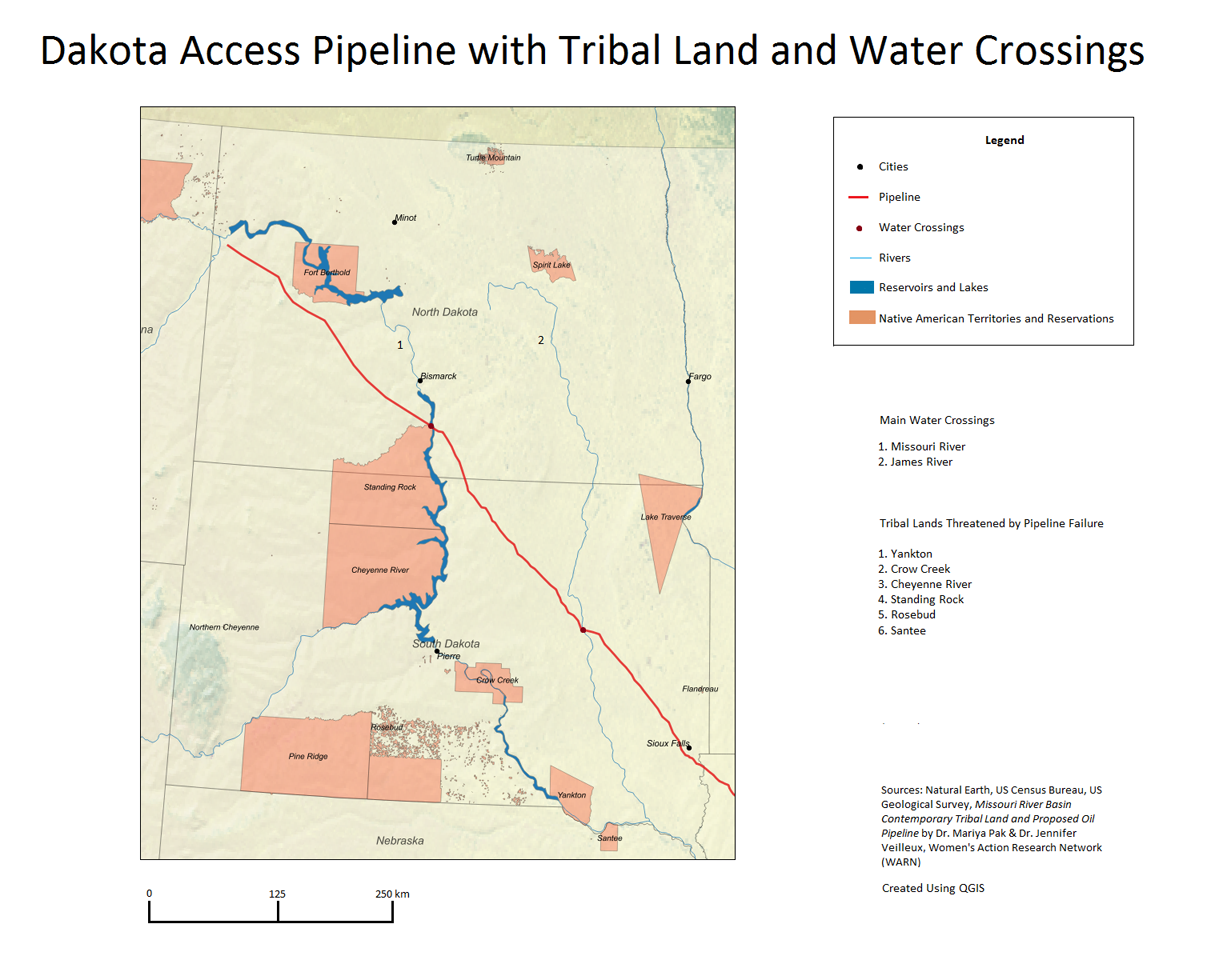
Liam Numrich
“Dakota Access Pipeline with Tribal Land and Water Crossings”
Boston, 2017.
The people of Standing Rock are members of the Dakota and Lakota nations, and their tribal lands are located in both North and South Dakota, as seen on this modern map. This area of the country features an abundance of non-renewable fossil fuels and other natural resources used for energy production; however, the land is sacred and culturally and environmentally significant to Native Americans. The Dakota Access Pipeline, illustrated here, is a 1,172 mile-long crude oil pipeline that runs both above and below ground from the Bakken area in North Dakota to Pakota, Illinois. The pipeline travels under Lake Oahe a half mile from tribal land, directly upstream from where Standing Rock residents source their water.
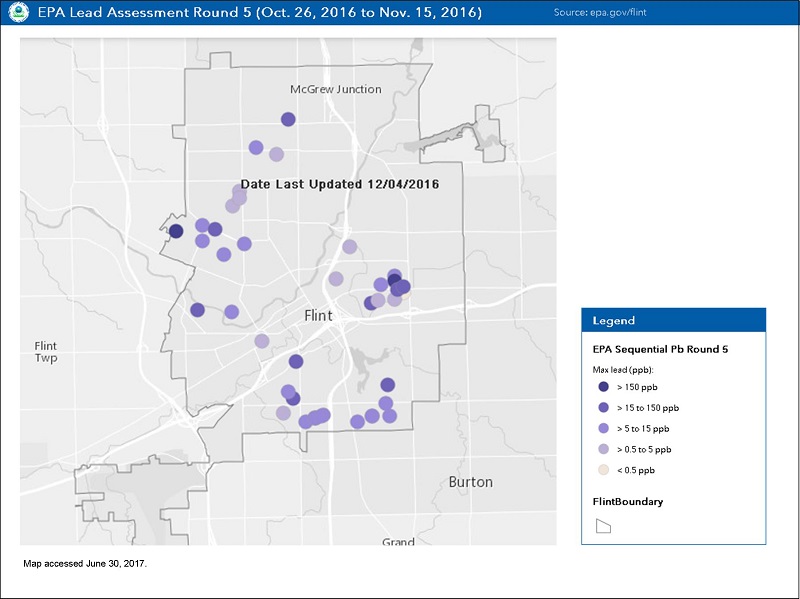
U.S. Environmental Protection Agency
“EPA Lead Assessment Round 1 (January 28 to March 21, 2016)”
[Washington, D.C., 2016], Reproductions, 2017.
Source: https://www.epa.gov/flint
In April 2014 the City of Flint, Michigan changed its water supply from that of Lake Huron, distributed with corrosion control treatment by the Detroit Water and Sewerage Department, to the Flint River. Water that was untreated ran through an aging system containing numerous lead pipes, and residents soon expressed concerns with taste, color, odor, and physical complaints including skin rashes. E. coli bacteria were found in the water, along with elevated levels of total trihalomethanes – disinfection byproducts found when a large amounts of chlorine are present. These findings prompted investigations by physicians, scientists and federal agencies, which deemed the situation in Flint a public health crisis.
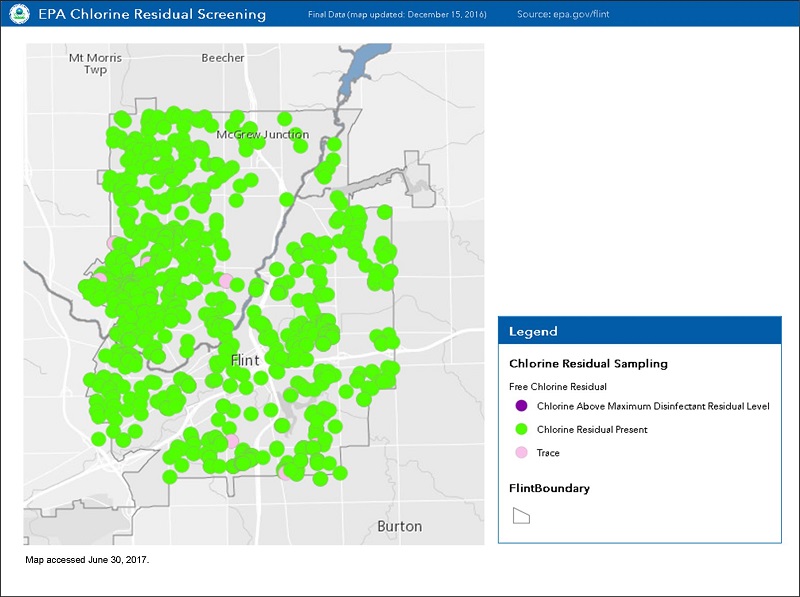
U.S. Environmental Protection Agency
“EPA Chlorine Residual Screening”
[Washington, D.C., 2016], Reproductions, 2017.
Source: https://www.epa.gov/flint
The Environmental Protection Agency (EPA) monitors the levels of lead in public drinking water, as lead is a neurotoxin – a poisonous substance that destroys the nervous system and is especially harmful to children and expectant mothers. The maps displayed here created by the EPA illustrate lead levels in unfiltered tap water throughout Flint (purple dots) and levels of chlorine (green dots). Lead levels were tested in 46 homes around the city in November 2016, to see if the corrosion control measures in place were working. Residual levels of chlorine were also measured throughout 2016, as indicated by the map with green dots, to test whether the amount of chlorine in the water was effective in killing bacteria and viruses. Currently, the EPA continues to recommend that Flint residents use filtered or bottled water for their daily needs.
8. Archaeology
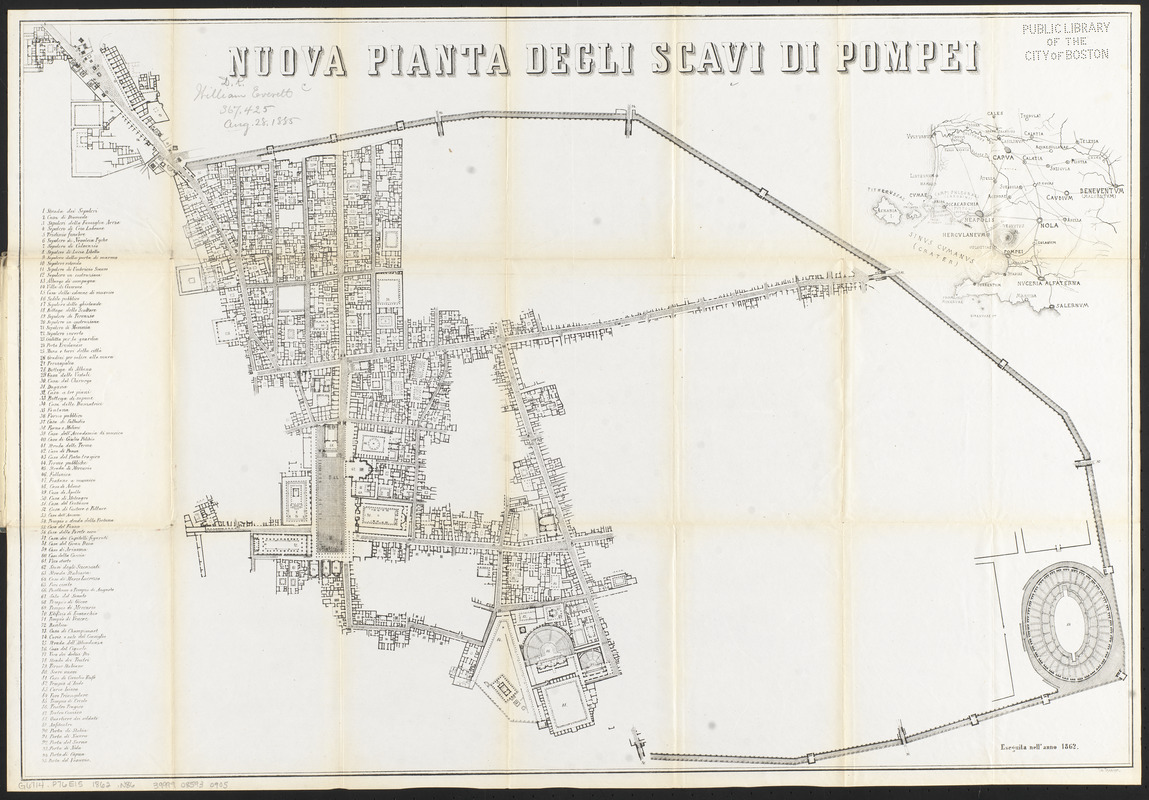
“Nuova Pianta Degli Scavi di Pompei”
[S.l.], 1862.
Located at the southeastern base of Mount Vesuvius, the ruins of the ancient city of Pompeii were discovered in the late-16th century; however, serious archaeological excavations did not begin at the site until the mid-18th century. The city had been “preserved in time” for nearly 1,700 years after Vesuvius exploded in 79 CE and buried the site in nearly 23 feet of volcanic debris. The 1862 map displayed here illustrates the excavations of Pompeii as they existed at that time, and lists 95 points of interest, including the Forum (65), the Triangular Forum (84) and the Amphitheatre (89).
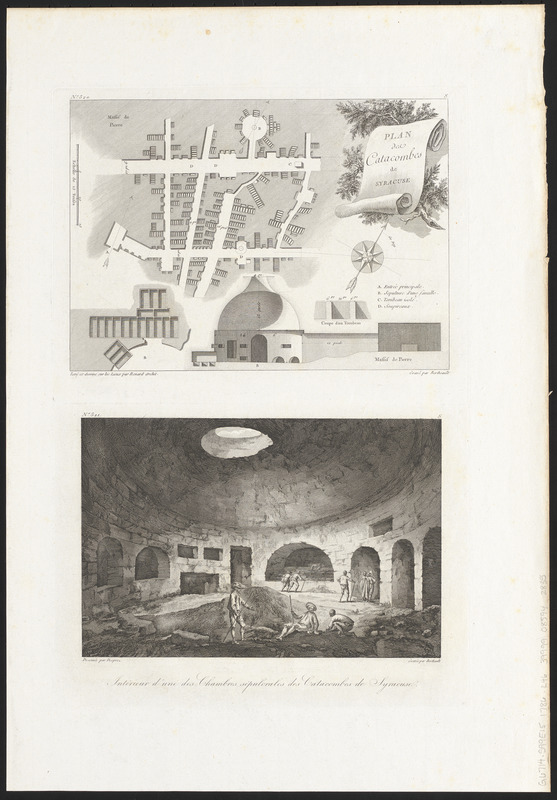
Jean-Claude Richard de Saint-Non (1727-1791)
“Plan des Catacombes de Syracuse; Interieur d’une des Chambres Sepulcrales des Catacombes de Syracuse,” from “Voyage Pittoresque …”
[Rome], 1795-98.
Syracuse, the main city of classical Sicily, was settled by the Corinthians in the 8th century BCE. By the 2nd century CE, Syracuse was under Roman control, and it was during this time that the first burials took place in the area now known as the Catacombs of San Giovanni. Displayed here in this late 18th-century print, the catacomb complex is believed to have been built upon existing aqueducts and cisterns used by ancient Syracuse residents. The map illustrates the pathways in the underground complex, along with large open spaces called rotundas and their occuli, or skylights, while the scene below depicts an expedition in the sepulcher.
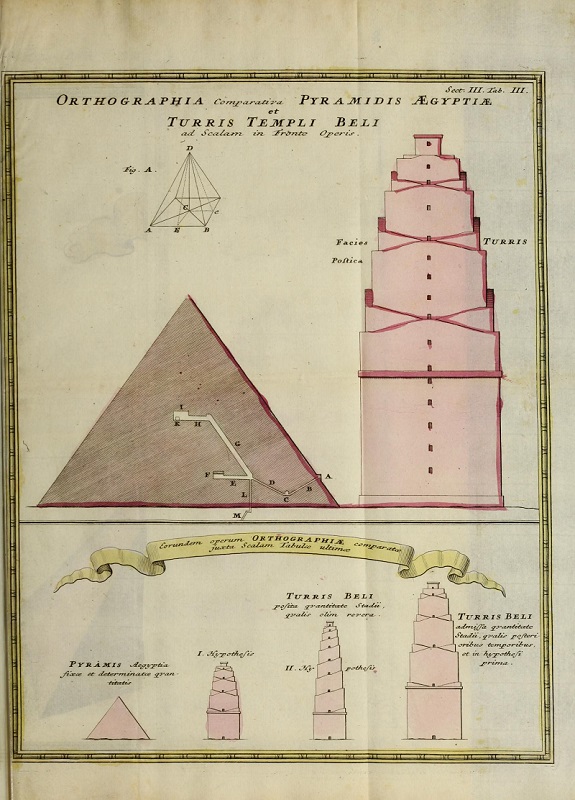
Johann Matthias Hase (1684-1742)
“Orthographia Comparativa Pyramidis Aegyptiae et Turris Templi Beli ad Scalum in Fronte Operis,” in “Regni Davidici et Salomonaei Descriptio Geographica et Historica …”
Nuremberg, 1739.
The field of archaeology had its beginnings in the 15th century, when Renaissance-era Europeans began uncovering Greece and Rome’s ancient pasts. The study of Egyptian archaeology started after Napoleon Bonaparte invaded the country in the late 18th century; however, the pyramids and other ancient sites in Egypt had been plundered and explored for thousands of years before. This 1739 Biblical geography illustrates the great pyramid at Giza, built as a tomb for the 4th-dynasty Pharaoh Khufu. The corridor lettered “M” here indicates the passage to the lower chamber, a subterranean room nearly 99 feet below ground that may have served a religious belief in an underworld afterlife.
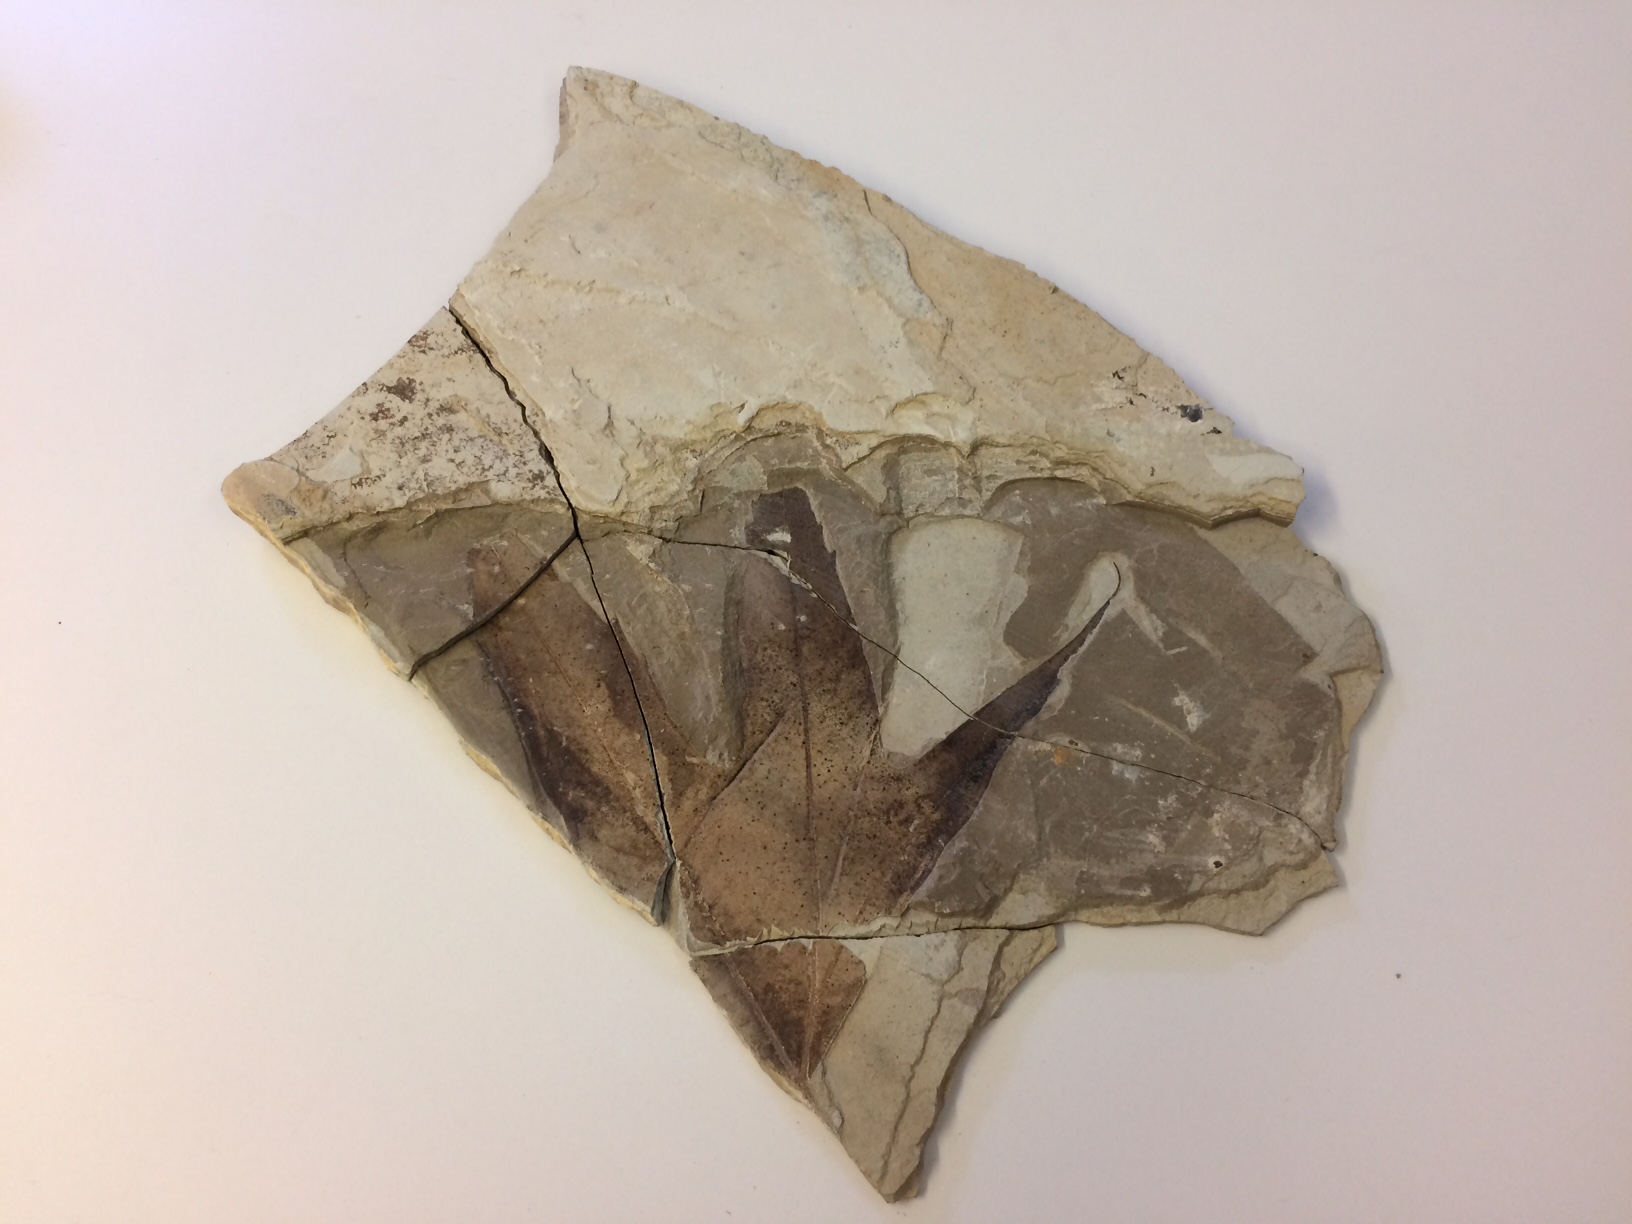
“Leaf Imprint (Possibly Sycamore) in Shale”
Eocene Period (56 to 33.9 million years ago), Douglas Pass, Colorado.
Private collection.
This leaf imprint, fossilized in shale strata, may be that of a sycamore. The fossil comes from Douglas Pass, Colorado, which is part of the Green River Formation, a site that is full of Eocene-era fossils.
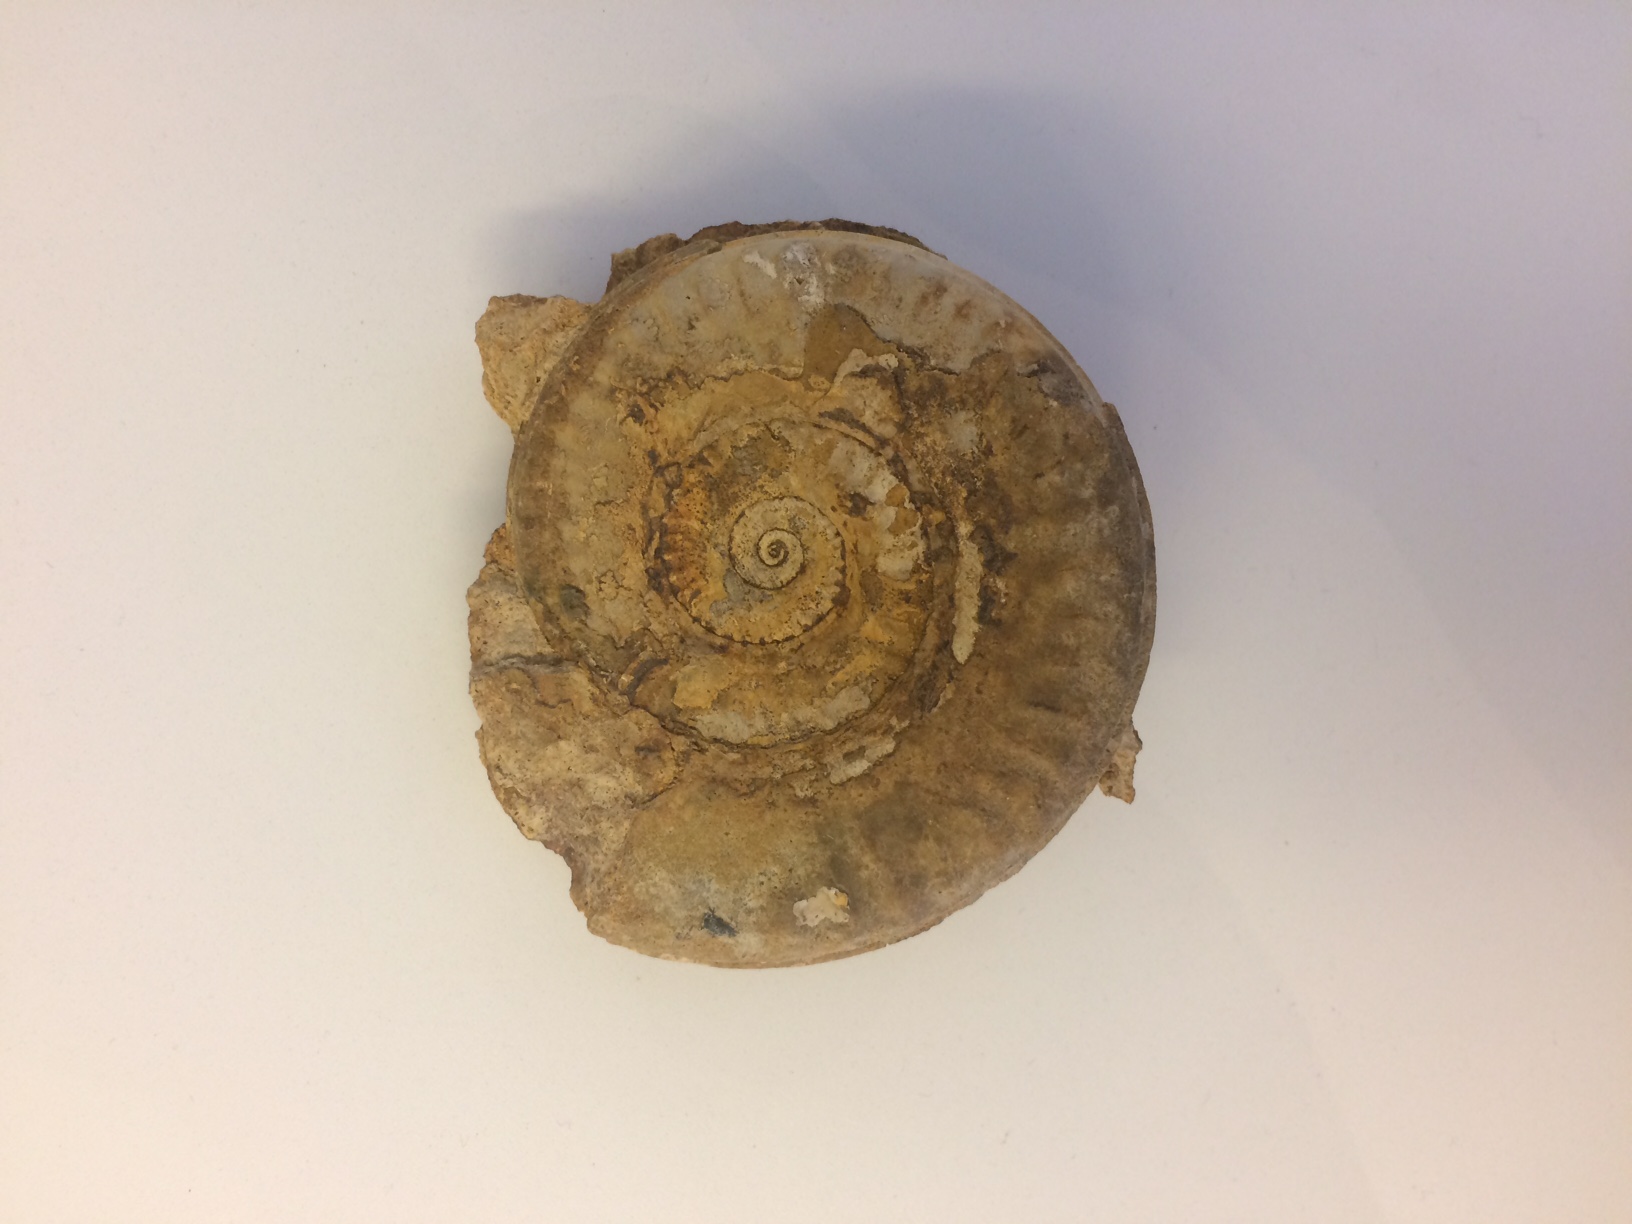
“Ammonoid”
Devonian Period (419 million years ago) to Cretaceous Period (66 million years ago), Paris, France.
Private collection.
Ammonoids are extinct ocean animals, and are related to the modern-day pearly nautilus. The ammonoid’s coiled shell served to support its body, and as protection from predators.
9. Beneath Boston
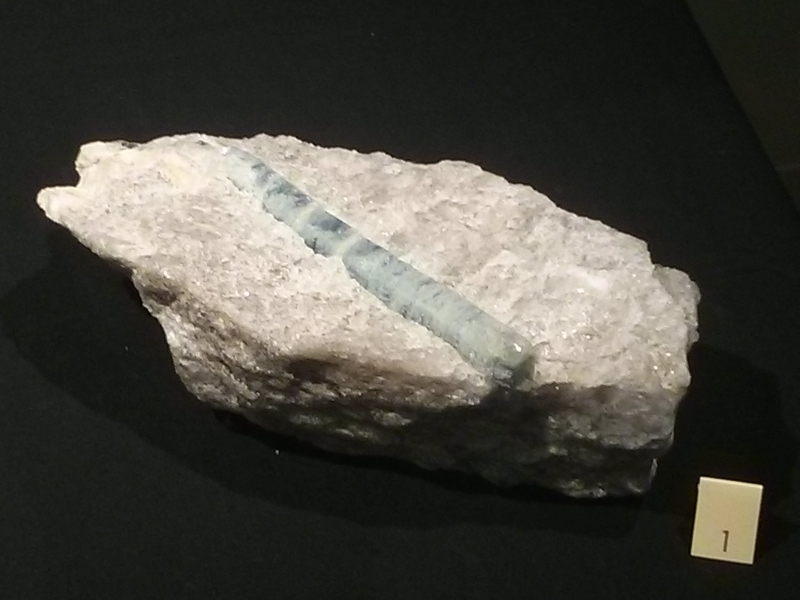
(1) Beryl; Royalston, Worcester County, Massachusetts
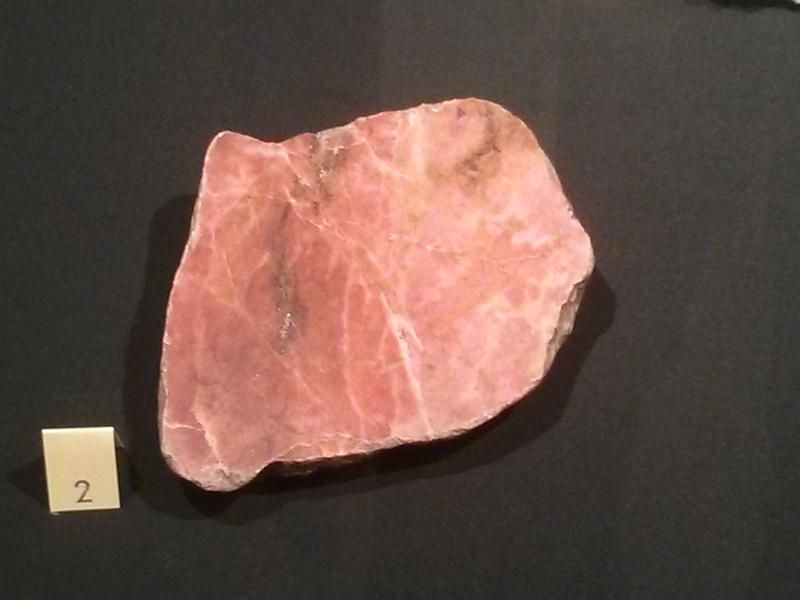
(2) Rhodonite; Plainfield, Hampshire County, Massachusetts; Betts Mine; Estate of Mary Shaub
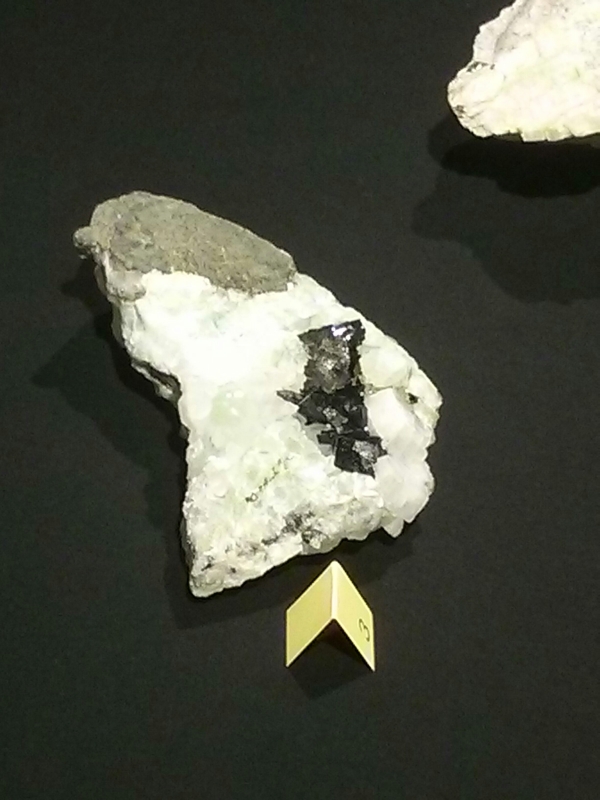
(3) Babingtonite; Westfield, Hampden County, Massachusetts; C.S. Hurlburt Jr.
Mineral specimens on loan from the Harvard Mineralogical & Geological Museum, Cambridge, MA.
The three mineral specimens on display here come from central and western Massachusetts. From Royalston, a town in northern Worcester County, the beryl specimen (1) is not as well-known as the gemstones derived from it – emerald and aquamarine. The pink rhodonite specimen (2) comes from Plainfield, and is a semiprecious gemstone that gets its name from the Greek “rhodon,” meaning rose. It is the state gemstone of Massachusetts. Babingtonite (3) is the official mineral of the state of Massachusetts, and this specimen from Westfield features glassy, black crystals embedded in a larger zeolite. Babingtonite was named for William Babington (1757-1833), an Irish physician and mineralogist, in 1824.
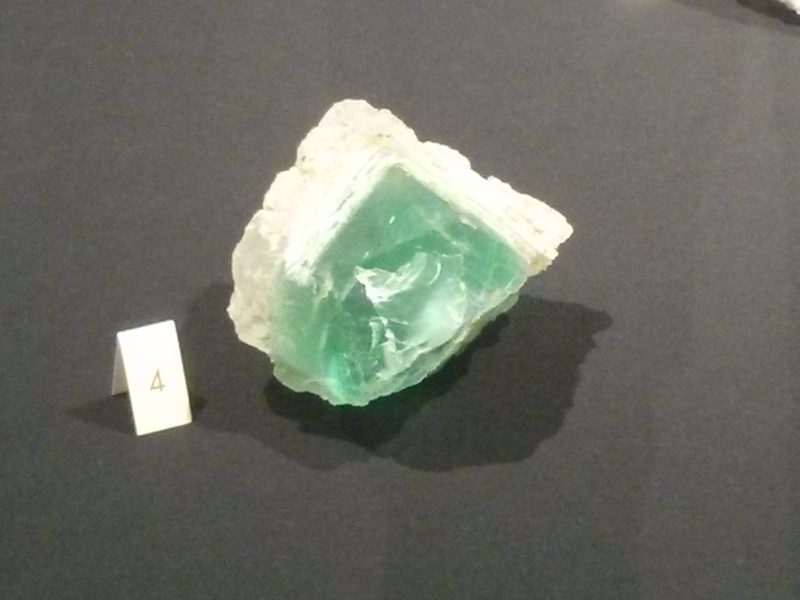
(4) Fluorite; Westmoreland, Cheshire County, New Hampshire; William Wise Mine; Lesnicks
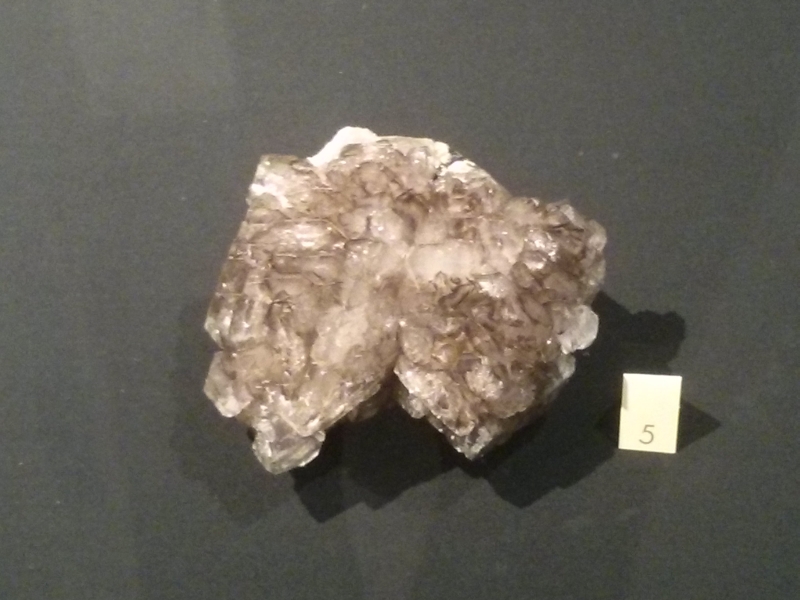
(5) Quartz; West Paris, Oxford County, Maine; W.D. Nevel
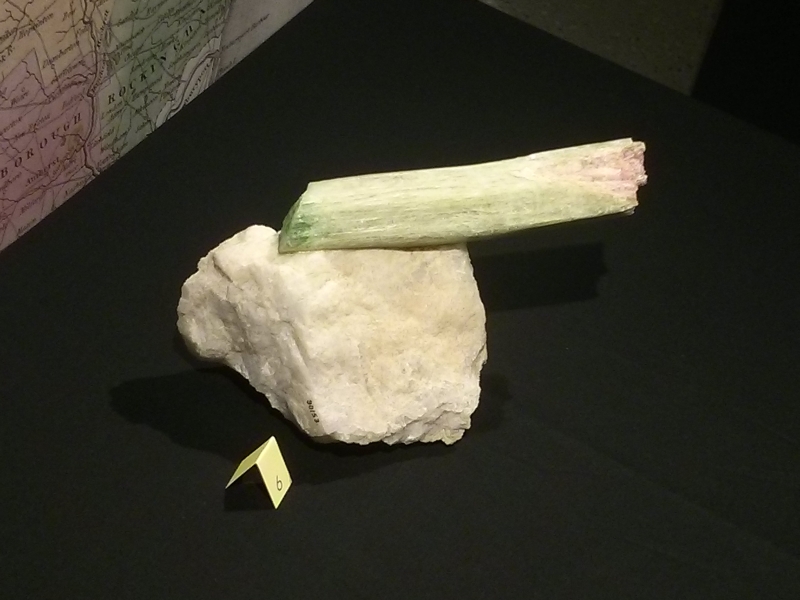
(6) Elbaite; Newry, Oxford County, Maine
Mineral specimens on loan from the Harvard Mineralogical & Geological Museum, Cambridge, MA.
The three mineral specimens on display here come from other locations throughout New England, including Maine and New Hampshire. The green fluorite specimen (4) comes from Westmoreland, a town in southwest New Hampshire bordering the Connecticut River. Fluorite is commonly used for industrial purposes. The grey quartz specimen (5) comes from West Paris, in Oxford County, Maine. Quartz is a common mineral, and can be clear and transparent, white, or vibrantly colored. Also from Maine, the elbaite specimen (6) belongs to a family of minerals known as tourmaline. The green and pink specimen here is commonly known as “watermelon tourmaline,” with its green “rind” and pink “fruit” inside.
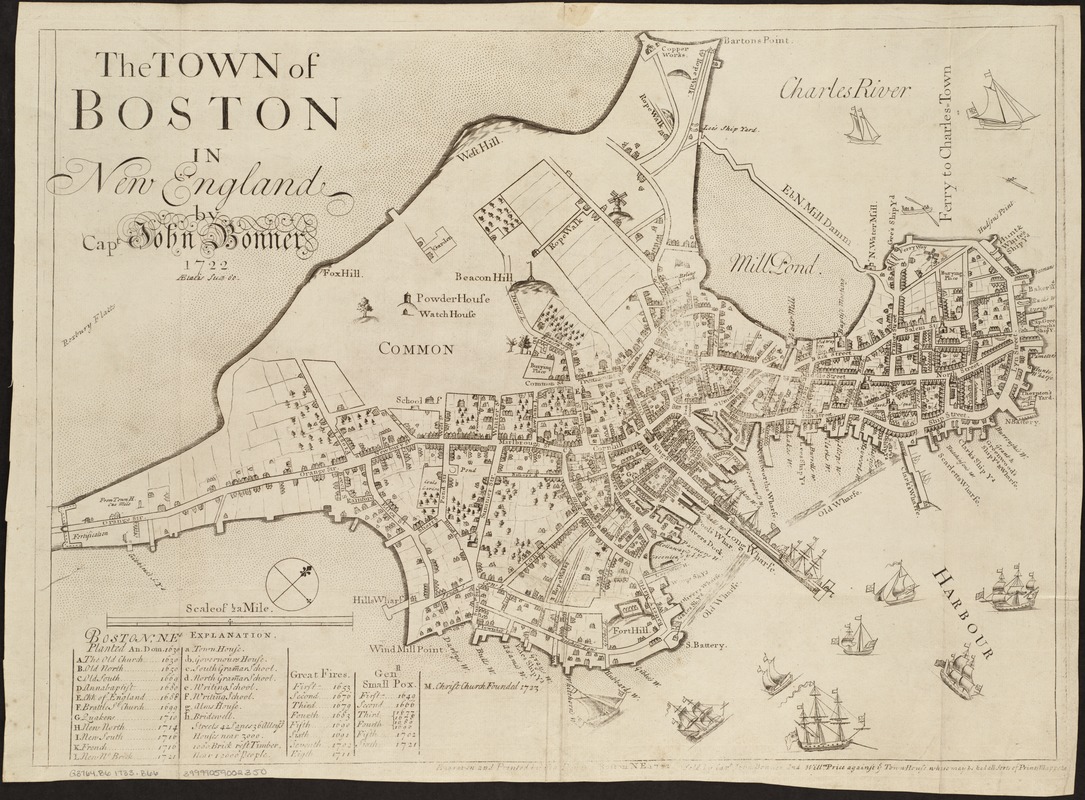
John Bonner (ca. 1643-1726)
“The Town of Boston in New England”
Boston, [1723-1732]
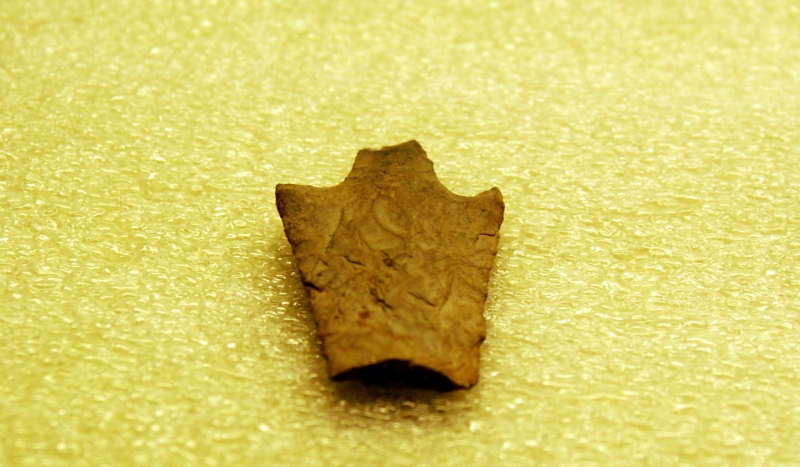
The city of Boston was settled by Europeans in 1630; however, the area had been home to Native Americans for thousands of years prior. This area, known as Shawmut to indigenous residents, was a peninsula that jutted out into Boston Harbor and was connected to the mainland by a thin strip called Boston Neck. This early 18th-century map illustrates the colonial “shape” of Boston nearly 100 years after Puritan colonists arrived, and depicts areas where Native objects were discovered during archaeological digs. Both the spear point and copper arrowhead displayed here were found in the Boston Common, while the fishweir stakes were found in nearby Back Bay.
(1) Neville Point. 7500-5500 BP (Before present). Boston Common.
(2) Fishweir Stakes. 5300-3700 BP (Before present). Back Bay.
(3) Arrowhead. Ca. 1600-1625. Boston Common.
Artifacts on loan from the City of Boston Archaeology Laboratory.
The three artifacts on display here, from the collections of Boston’s Archaeology Laboratory, date from thousands of years before the arrival of Europeans in the city, to the early-17th century. The Neville Point (1) was located in the Boston Common, near the present-day Frog Pond. This stone point dates from 7,500-5,500 years ago, and would have been used as a knife or a spear for hunting. The fishweir stakes (2) date from 5,300-3,700 years ago, and were discovered in 1946 during construction in the Back Bay. Built along Boston’s ancient coastlines by Native fishermen, weirs were fence-like structures that would trap fish for easy gathering. The copper arrowhead (3) dates from the first quarter of the 17th century, and was found under the Great Elm, once located in Boston Common. This arrowhead represents the transition in Native toolmaking from stone to metals, and is the only copper arrowhead found in Boston.
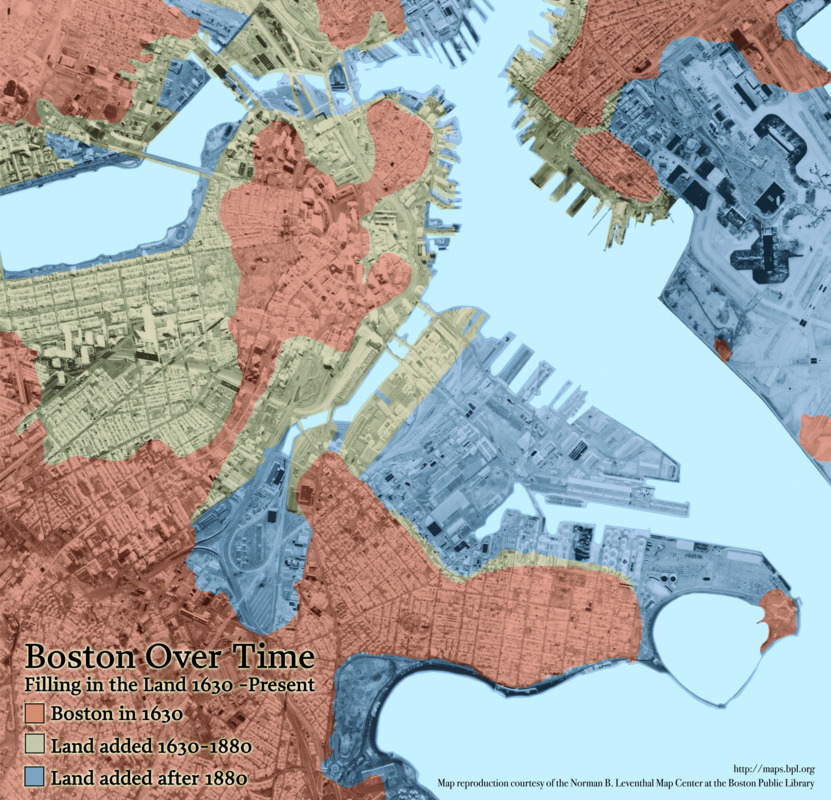
Chan Krieger and Associates
“Boston Over Time: Filling In the Land 1630-Present”
Boston, 2008.
This modern map illustrates the various “land making” projects that have shaped Boston over the past three centuries, along with locations where the five artifacts on display here were unearthed. The pink landmass represents the original Shawmut Peninsula and mainland region, where Native Americans dwelled for millennia, and where Puritan colonists settled in 1630. The tan area represents land made from the 17th-19th centuries, while the blue indicates the most recent additions. Four of the artifacts were found in the oldest landmasses, while the fifth artifact – the fishweir stakes – was found in what was water thousands of years ago.
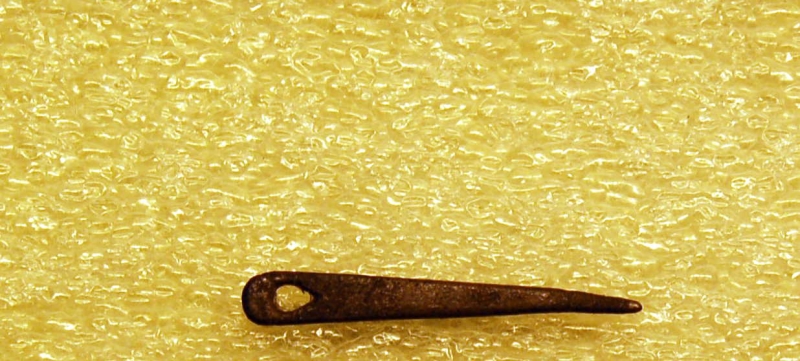
(4) Sail Needle. 18th century. City Square, Charlestown.
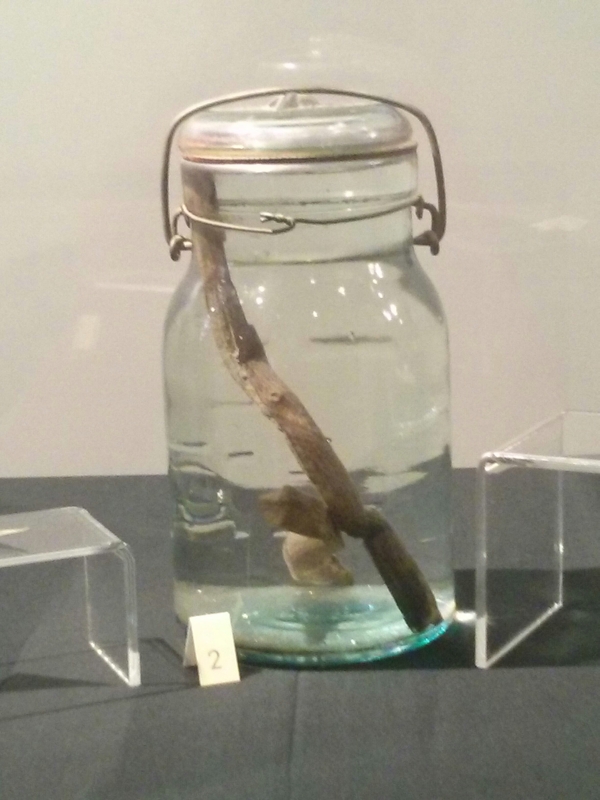
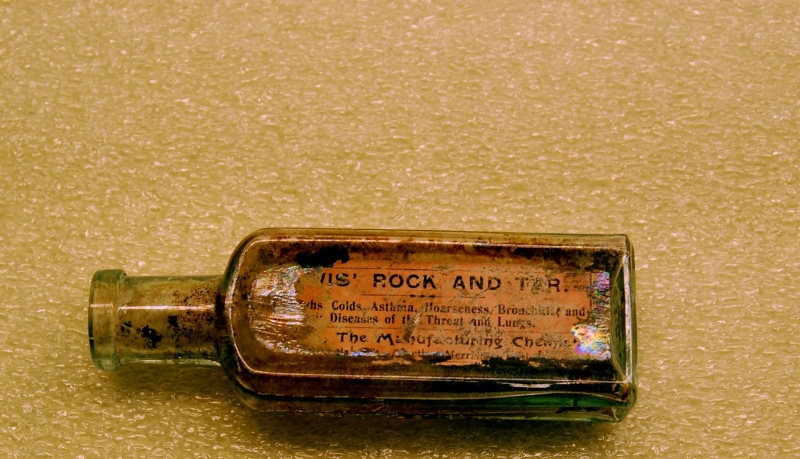
(5) Rock and Tar Bottle. 1895. Blake House Site, Dorchester.
Artifacts on loan from the City of Boston Archaeology Laboratory.
These more “modern” artifacts relate to Boston’s various industries over the centuries. The sail needle (4) dates from the 18th century, and was discovered in what is now City Square in Charlestown. Boston was a bustling port city in the 18th century, and the maritime trades were a major source of employment and economic activity. This copper needle would have been used in the maintenance of canvas sails. The glass bottle (5), found at the Blake House site in Dorchester, is a late-19th century example of a medicine manufactured in Boston. The label states the concoction was used to treat respiratory ailments.
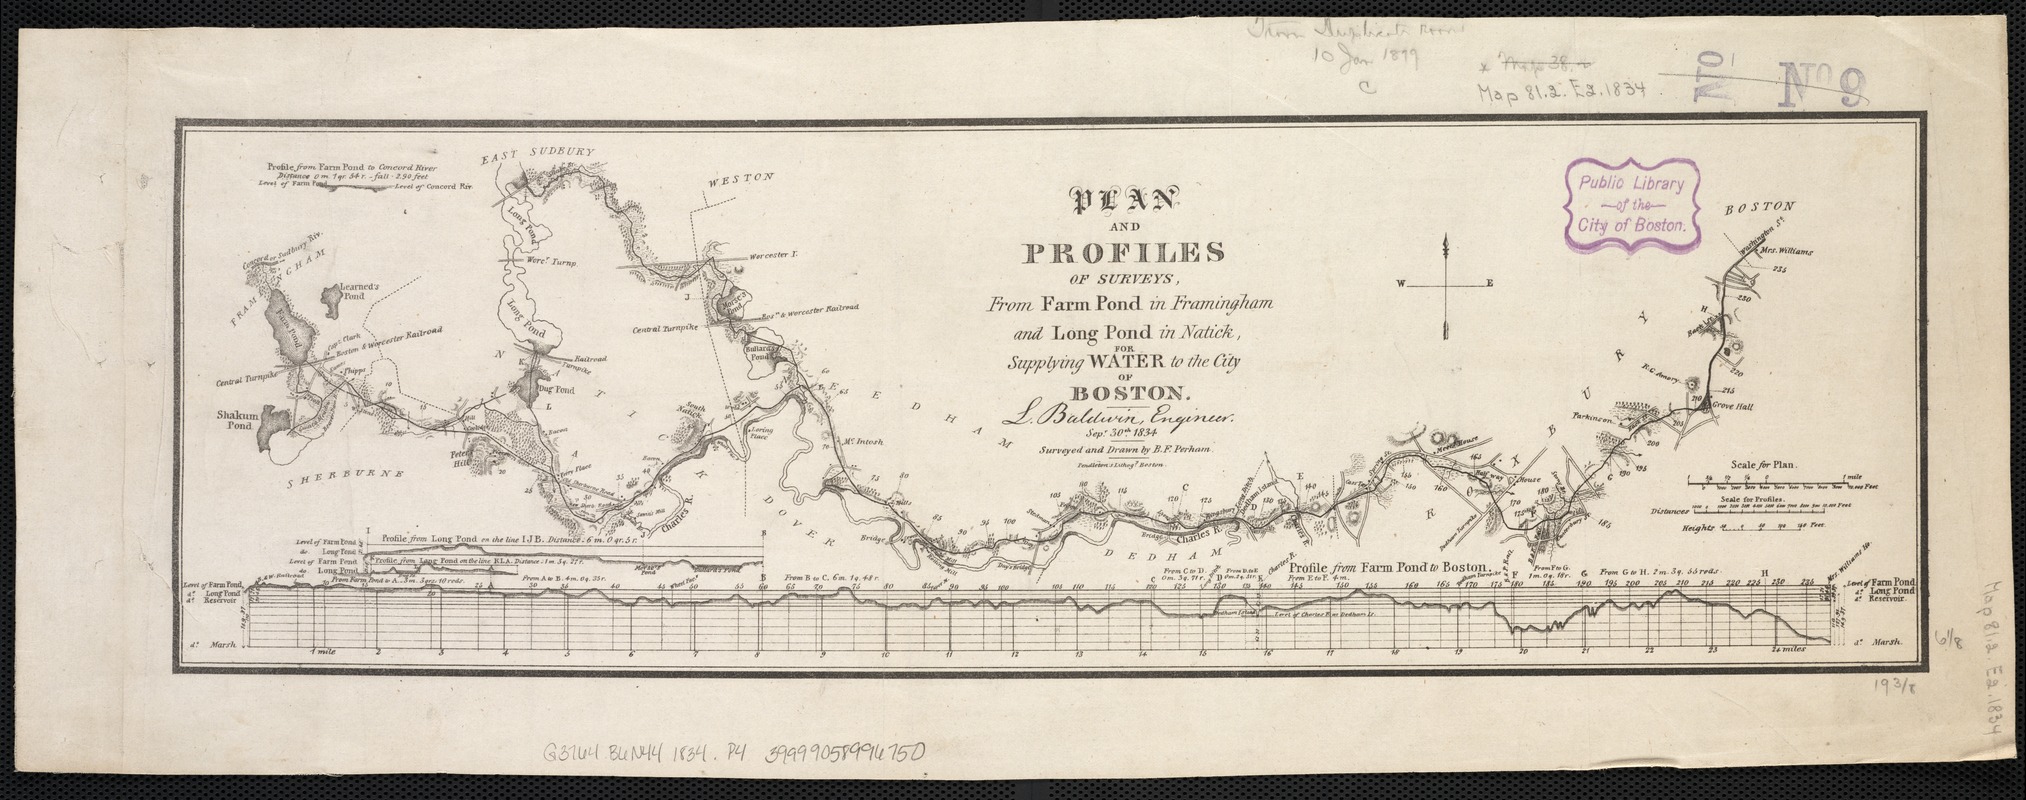
Benjamin Franklin Perham (1806-ca. 1837)
“Plan and Profiles of Surveys, from Farm Pond in Framingham and Long Pond in Natick, for Supplying Water to the City of Boston”
Boston, 1834.
From the colonial settlement of Boston in 1630 until 1796, the City’s water supply came from underground wells and cisterns that collected rainwater. To alleviate the effects of using unhealthy and dirty water, the City installed the first underground water pipes in the late 1790s, drawing water from Jamaica Pond. An updated water supply plan, illustrated in this map, was conceived by civil engineer Loammi Baldwin in 1834. Baldwin’s plan called for water to be transported from Long Pond (now Lake Cochituate) in Natick via an above and below ground gravity aqueduct that would deposit good-quality water into a reservoir. From there, lead and cast iron pipes transported the water throughout the city.
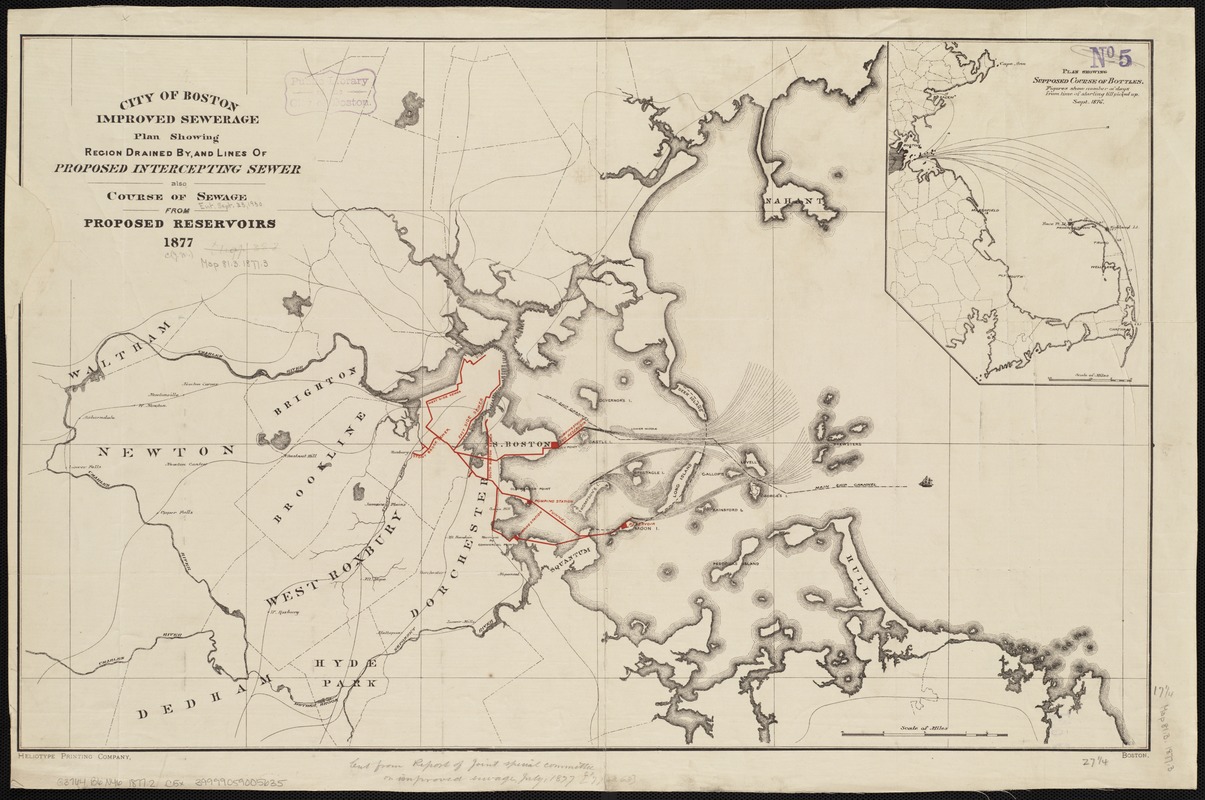
Boston (Mass.). City Council. Joint Special Committee on Improved Sewage.
“City of Boston Improved Sewerage: Plan Showing Region Drained by, and Lines of Proposed Intercepting Sewer, also Course of Sewer from Proposed Reservoirs 1877
Boston, [1877]
With a clean water supply system in place by the mid-19th century, Boston then focused on disposal of waste water. Up to the mid-1870s, sewers were built privately, but with an increase in population and pollution, drainage problems loomed. This 1877 map illustrates proposed subterranean sewer lines, along with reservoirs and pumping stations at the coast. From these sites, waste water would flow into Boston Harbor, as displayed here. Drinking water continued to be affected after new lines were constructed, which prompted the state to establish the cooperative Metropolitan Sewerage District, the first of its kind in the United States.
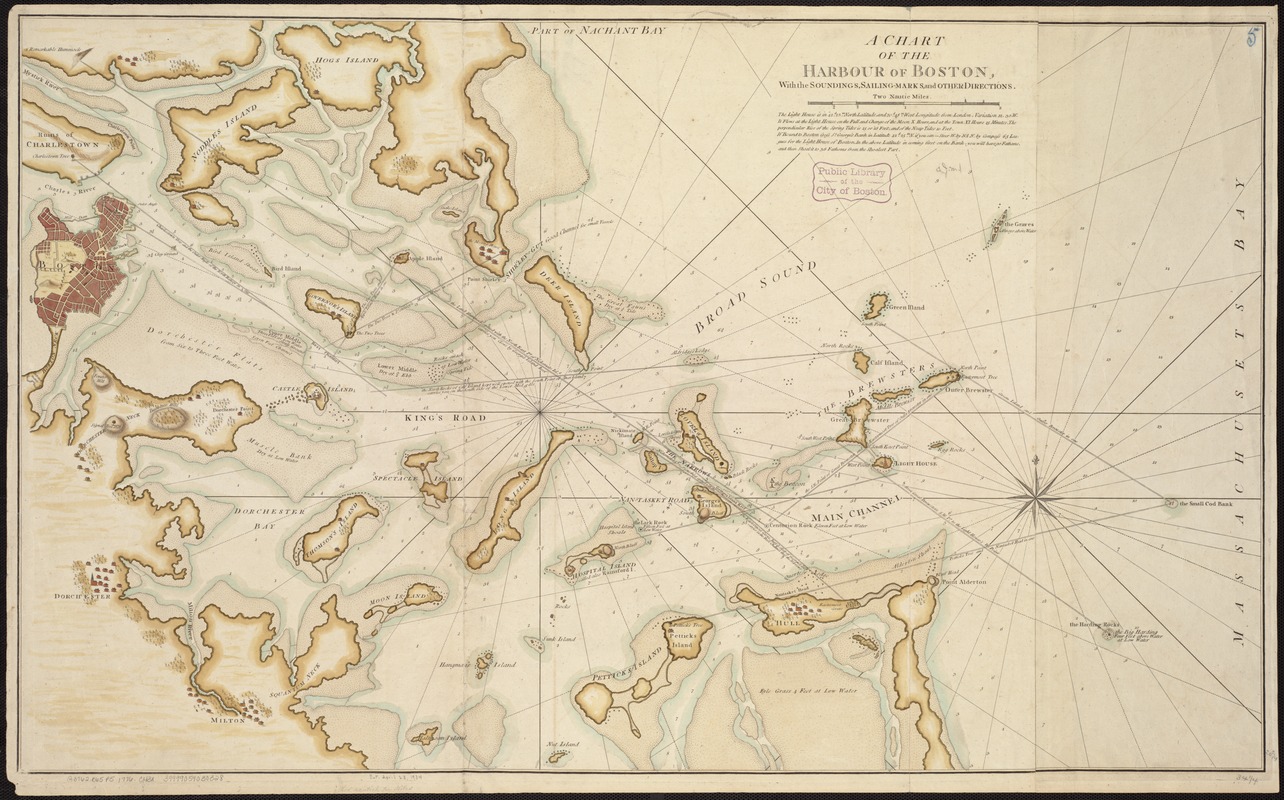
Robert Sayer and John Bennett (Firm)
“A Chart of the Harbour of Boston, with the Soundings, Sailing-marks, and Other Directions”
[London, 1776]
The oldest surviving charts depicting the Mediterranean Sea date to the 13th century; however, these earliest maps created by mariners for navigational purposes did not reflect features beneath the surface of the water. It was not until the production of the first Dutch sea atlas in the late-16th century that nautical charts began recording bathymetric (underwater depth) information. By the late-18th century, mariners had developed established methods for recording underwater depths, landforms and hazards, as seen on this chart of Boston Harbor. Soundings – water depths at specific locations – are represented by numbers indicating fathoms here, while shoals and sandbanks are illustrated with stippling.
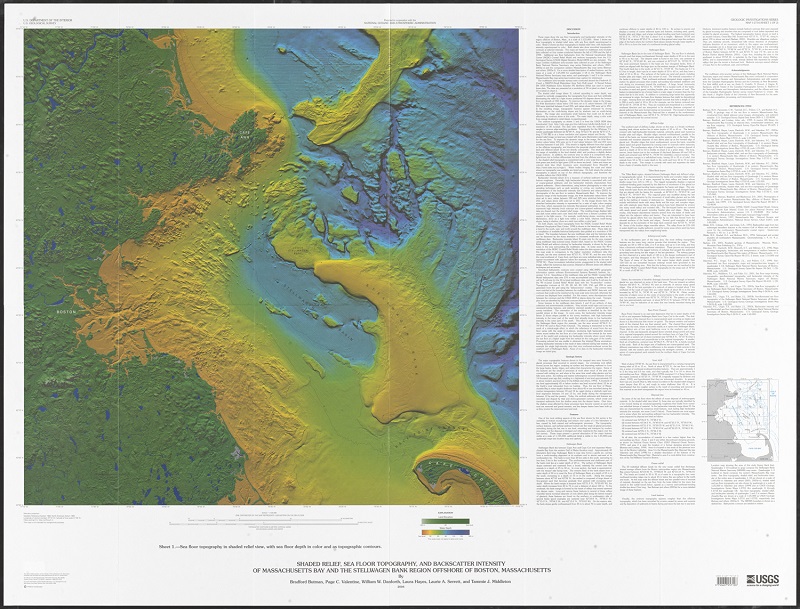
Bradford Butman et al.
“Shaded Relief, Sea Floor Topography, and Backscatter Intensity of Massachusetts Bay and the Stellwagen Bank Region Offshore of Boston, Massachusetts”
[Reston, VA]: U.S. Geological Survey, 2004.
This 21st-century map of the seafloor off Boston’s coast reveals in detail what the underwater landscape looks like in the area. By using shaded relief, the heights of rocks, ledges and other structures underwater are illustrated, while a color scale indicates depth. Contour lines surrounding areas of equal depth also help reveal the varied surface of the ocean floor. Bathymetric information was gathered using an echo-sounder method – a type of sonar that detects objects underwater using reflecting sound waves. Prior to sonar, seafloor depths were obtained by manually lowering weighted lines into the water and recording data, as evidenced by the soundings in the map by Sayer and Bennett.
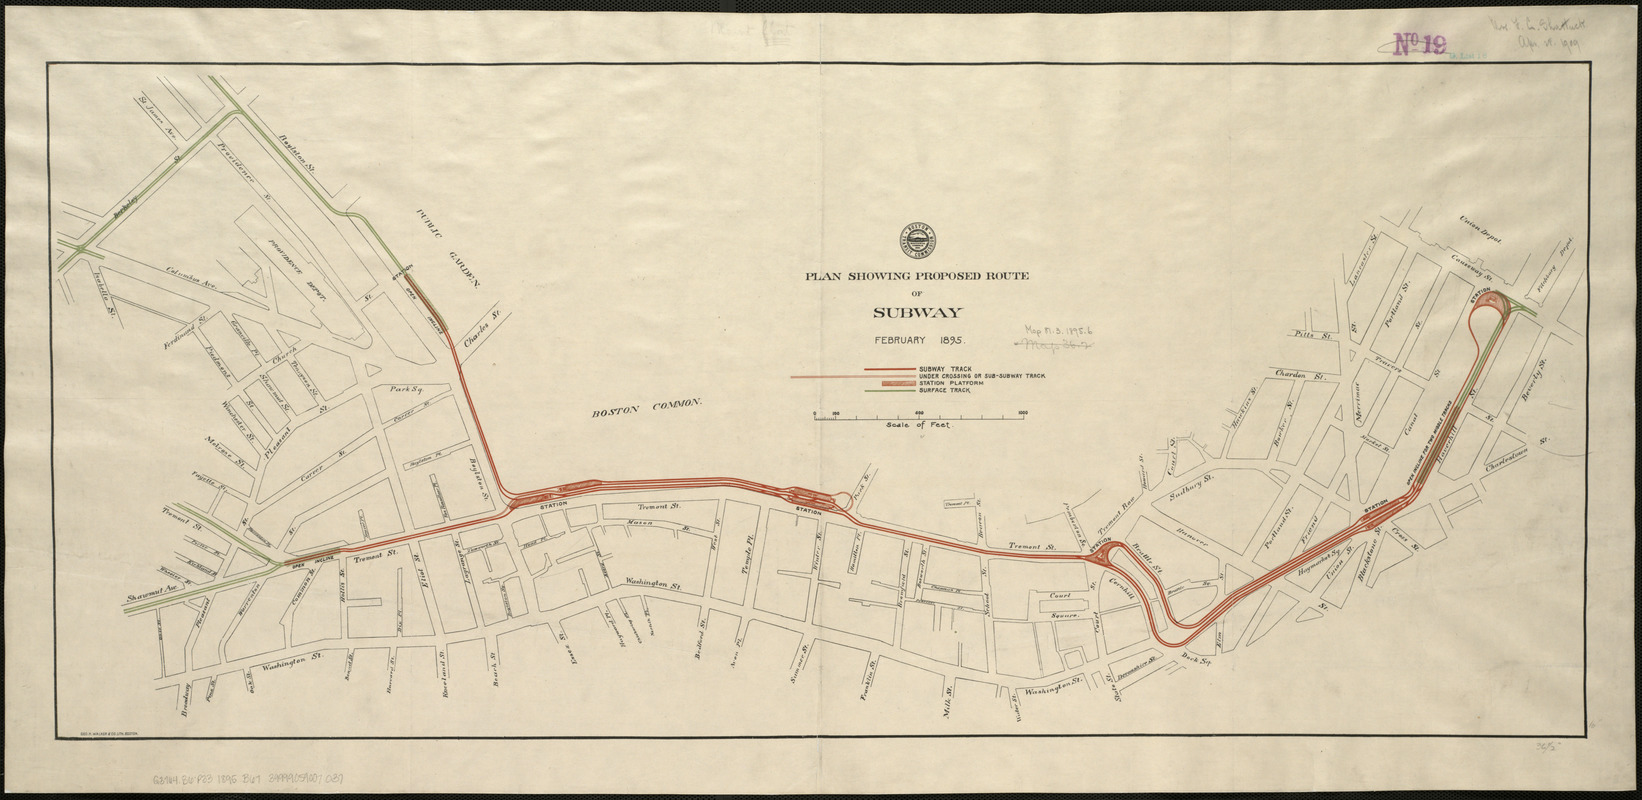
Boston (Mass.) Transit Commission
“Plan Showing Proposed Route of Subway, February 1895”
Boston, [1895]
By the late-19th century, Boston was grappling with a rapidly expanding population that needed reliable transportation throughout the city for their daily needs. Tremont Street near Boston Common was the epicenter of a chaotic transit network, seeing hundreds of horse-drawn carriages, street-cars, and pedestrians during rush hour. The controversial remedy to Boston’s transit nightmare was the subway. This 1895 map shows the first route planned, from the Public Garden to North Station. On September 1, 1897, Boston’s first underground car ran from the Garden to Park Street, and the city became the first in the United States with a subway system.
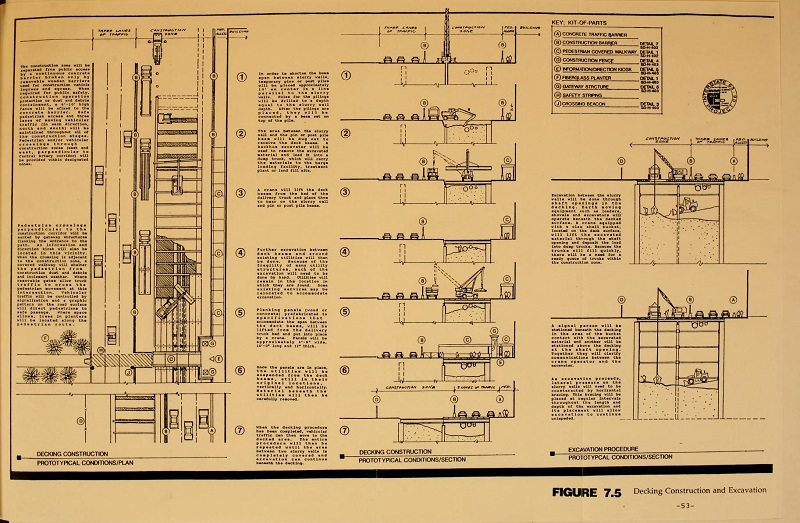
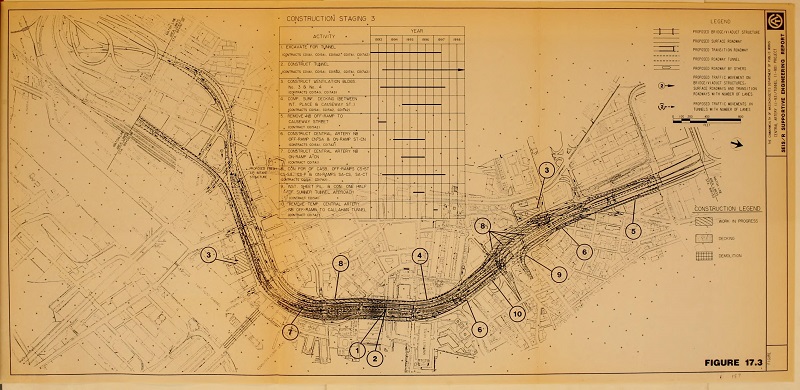
Bechtel/Parsons Brinckerhoff; Massachusetts Dept. of Public Works
“Figure 7.5: Decking Construction and Excavation” and “Figure 17.3: Construction Staging 3,” from “Central Artery (I-93)/Tunnel (I-90) Project …”
[Boston?], 1991. Reproductions, 2017.
Courtesy BPL Social Sciences Department.
The Central Artery/Tunnel Project, more commonly known as the Big Dig, was the largest and most complex infrastructure project in the history of the United States. The goal of the Big Dig was to replace a six-lane elevated highway with an eight-to-ten-lane underground highway, thereby alleviating major traffic congestion on Boston’s roadways. The project began in 1982 and lasted until 2007, costing over $24 billion including interest. The illustration displayed above shows how tunnels were dug while maintaining traffic flow, while the map details construction plans related to demolition, excavation and installation in the early-1990s. The project was controversial due to cost, time and mistakes, including a deadly ceiling collapse in 2006, while the physical results are more open space, less congestion and reconnected neighborhoods above ground.
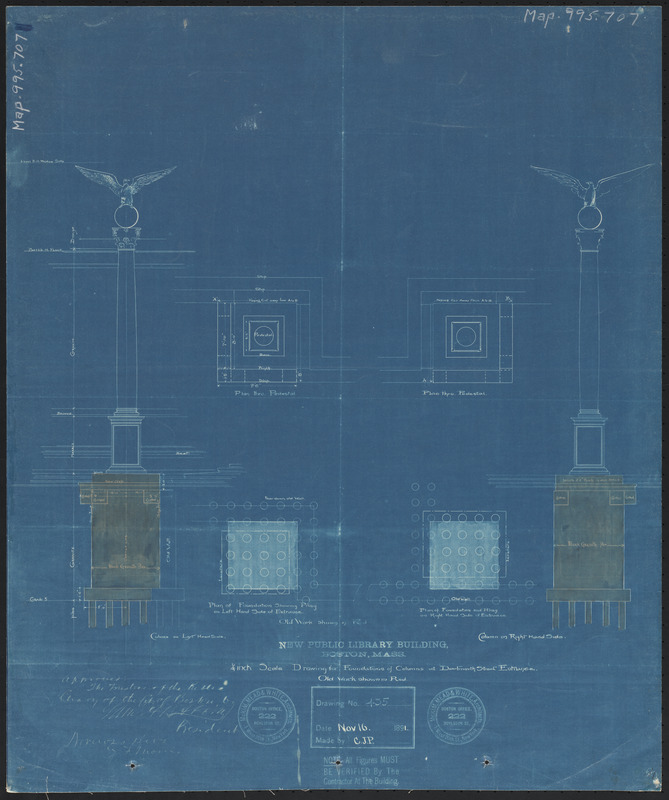
McKim, Mead & White
“Drawing for Foundations of Columns at Dartmouth Street Entrance”
Boston, 1891. Reproduction, 2017.
Courtesy Boston Public Library.
The Boston Public Library was originally located in a small building on Mason Street near the Common, until it moved to its new home in the Back Bay in 1895. Designed by famed architect Charles F. McKim, this “palace for the people” was built upon the “made” land that characterized the neighborhood. The blueprint drawing here, originally created in 1891, illustrates design concepts for the McKim Building’s façade. Under a pair of block granite piers intended to support decorative columns, “piles” appear. Wooden pilings are thirty-foot long structural supports, driven into the hard clay below the Library’s foundation. They are present under most buildings in Back Bay.
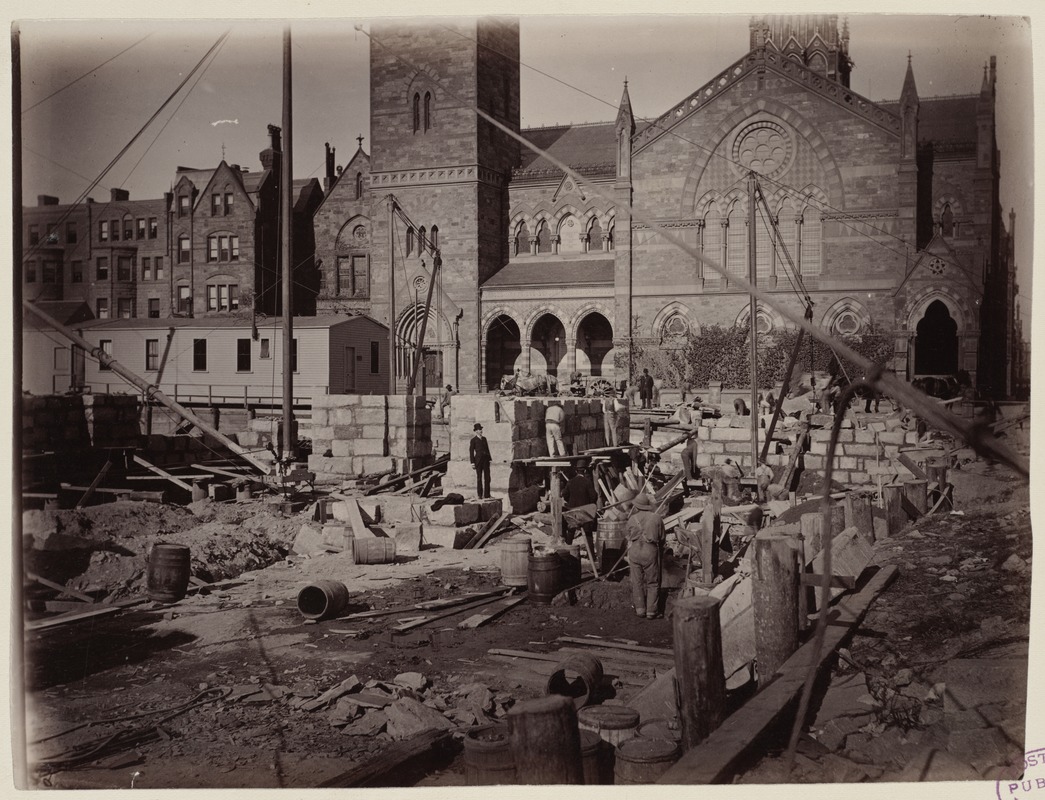
Edward F. Stevens (1860-1946)
“Foundation Work at the Corner of Boylston and Dartmouth Streets, Construction of the McKim Building”
[Boston], 1888.
Courtesy BPL Print Department.
Originally taken in 1888, this photograph illustrates how the foundation of the McKim Building was constructed. The wooden pilings that support the building’s foundation are apparent in the lower right of the photograph. Similar in shape and size to modern telephone poles, these pilings must remain wet to prevent them from rotting when dried out. If the top portion of a piling rots, the foundation it supports may give way and cause structural damage. The McKim Building’s foundation suffered damage in 1929 as a result of rotted pilings. The rotten portions were replaced by steel and concrete supports, called underpinnings.
Bibliography
Adams, Frank. Pennsylvania’s Northern Anthracite Coal Field, 1870-1970. http://www.northernfield.info/.
Aisch, Gregor and K.K. Rebecca Lai. “The Conflicts Along 1,172 Miles of the Dakota Access Pipeline. New York Times. 25 January 2017. https://www.nytimes.com/interactive/2016/11/23/us/dakota-access-pipeline-protest-map.html?mcubz=0&_r=0.
American Coal Foundation. Timeline of Coal in the United States. 2005. http://www.teachcoal.org/lessonplans/pdf/coal_timeline.pdf.
American Philosophical Society. Transactions of the American Philosophical Society. Volume VI. Philadelphia: C. and C. Conrad and Co., 1809. https://babel.hathitrust.org/cgi/pt?id=hvd.32044089272488;view=1up;seq=5.
Amherst College Archives & Special Collections. “Edward and Orra White Hitchcock Papers, 1805-1910 1811-1864.” Five College Archives & Manuscript Collections. http://asteria.fivecolleges.edu/findaids/amherst/ma27.html.
Bagley, Joseph M. A History of Boston in 50 Artifacts. Hanover, NH: University Press of New England, 2016. [F73.39 .B34 2016]
Barton, Kate E., David G. Howell, and José F. Vigil. The North America Tapestry of Time and Terrain. [Reston, Va.]: United States Geological Survey, 2003. https://pubs.usgs.gov/imap/i2781/.
Bonacini, Elisa, Graziana D’Agostino, Mariateresa Galizia, Cettina Santagati, and Mariarita Sgarlata. “The Catacombs of San Giovanni in Syracuse: Surveying, Digital Enhancement and Revitalization of an Archaeological Landmark.” In Progress in Cultural Heritage Preservation, 4th International Conference, EuroMed 2012, Limassol, Cyprus, October 29-November 3, 2012 Proceedings, edited by Marinos Ioannides, Dieter Fritsch, Johnanna Leissner, Rob Davies, Fabio Remondino, and Rossella Caffo, 396-403. Heidelberg: Springer, 2012. https://www.academia.edu/2120671/.
Bonewitz, Ra. Rocks and Minerals. London ; New York: DK Pub., 2012. [QE432 .B66 2012x]
Booms, Dirk and Peter Higgs. Sicily: Culture and Conquest. Ithaca, NY: Cornell Univ. Press, 2016. [DG865.B66 2016]
Boston Groundwater Trust. Boston Groundwater Trust. http://www.bostongroundwater.org/.
Britannica Library, s.v. "Archaeology," accessed August 4, 2017, http://library.ebonline.com/levels/adults/article/archaeology/108623.
Britannica Library, s.v. “Bathymetry,” accessed July 18, 2017, http://library.ebonline.com/levels/adults/article/bathymetry/13753.
Britannica Library, s.v. "Boston," accessed August 15, 2017, http://library.ebonline.com/levels/adults/article/Boston/106092.
Britannica Library, s.v. "Caldera," accessed July 17, 2017, http://library.ebonline.com/levels/adults/article/caldera/18640.
Britannica Library, s.v. "Coal mining," accessed August 22, 2017, http://library.ebonline.com/levels/adults/article/coal-mining/110682.
Britannica Library, s.v. "Earth exploration," accessed June 30, 2017, http://library.ebonline.com/levels/adults/article/Earth-exploration/111024.
Britannica Library, s.v. "Fate," accessed July 11, 2017, http://library.ebonline.com/levels/adults/article/Fate/33810.
Britannica Library, s.v. "Geyser," accessed July 17, 2017, http://library.ebonline.com/levels/adults/article/geyser/36646.
Britannica Library, s.v. “Hydrologic sciences,” accessed July 18, 2017, http://library.ebonline.com/levels/adults/article/hydrologic-sciences/106193.
Britannica Library, s.v. "Lava," accessed July 13, 2017, http://library.ebonline.com/levels/adults/article/lava/47378.
Britannica Library, s.v. "Old Faithful," accessed July 17, 2017, http://library.ebonline.com/levels/adults/article/Old-Faithful/56973.
Britannica Library, s.v. "Pompeii," accessed July 11, 2017, http://library.ebonline.com/levels/adults/article/Pompeii/60753.
Britannica Library, s.v. "Pyramids of Giza," accessed August 4, 2017, http://library.ebonline.com/levels/adults/article/Pyramids-of-Giza/36944.
Britannica Library, s.v. "Syracuse," accessed August 8, 2017, http://library.ebonline.com/levels/adults/article/Syracuse/70768.
Britannica Library, s.v. "Thanatos," accessed July 11, 2017, http://library.ebonline.com/levels/adults/article/Thanatos/473468.
Britannica Library, s.v. "Vesuvius," accessed July 11, 2017, http://library.ebonline.com/levels/adults/article/Vesuvius/75197.
Britannica Library, s.v. "Volcano," accessed July 11, 2017, http://library.ebonline.com/levels/adults/article/volcano/108777.
Britannica Library, s.v. "Yellowstone National Park," accessed July 17, 2017, http://library.ebonline.com/levels/adults/article/Yellowstone-National-Park/77914.
City of Hazleton, Pennsylvania. “History.” City of Hazleton, Pennsylvania. http://www.hazletoncity.org/Life/history-of-hazleton.html.
Clark, Gregor and Vesna Maric. Sicily. 6th ed. Melbourne ; Oakland, CA: Lonely Planet, 2014.
Clarke, Eliot C. Main Drainage Works of the City of Boston (Massachusetts, U.S.A.). Boston: Rockwell and Churchill, 1885. [GOV DOCS TD525.B6C5x]
Dana, James Dwight. Dana’s New Mineralogy: The System of Mineralogy of James Dwight Dana and Edward Salisbury Dana. New York: Wiley, 1997. [QE372 .D23 1997]
Eakins, Barry W., Joel E. Robinson, Toshiya Kanamatsu, Jiro Naka, John R. Smith, Eiichi Takahashi, and David A. Clague. Hawaii’s Volcanoes Revealed. [Reston, Va.]: U.S. Dept. of the Interior, U.S. Geological Survey, 2003. https://pubs.usgs.gov/imap/2809/.
Earth Observatory. “Coal Controversy in Appalachia.” Earth Observatory, National Aeronautics and Space Administration. https://earthobservatory.nasa.gov/Features/MountaintopRemoval/.
Earthquake Hazards Program. “Induced Earthquakes: Myths and Misconceptions.” Earthquake Hazards Program, United States Geological Survey. https://earthquake.usgs.gov/research/induced/myths.php.
Earthquake Hazards Program. “Seismic wave.” Earthquake Glossary, United States Geological Survey. https://earthquake.usgs.gov/learn/glossary/?term=seismic%20wave.
Ehrenberg, Ralph E., curator. The Earth Revealed: Aspects of Geologic Mapping [Exhibition]. Library of Congress, Geography & Map Division, Washington, D.C. 10 July 1989-7 January 1990.
Embley, Bob. “Seafloor Mapping.” Ocean Explorer, National Oceanic and Atmospheric Administration. http://oceanexplorer.noaa.gov/explorations/03fire/background/mapping/mapping.html.
Encyclopaedia Britannica, s.v. “Ammonoid,” accessed September 19, 2017, https://www.britannica.com/animal/ammonoid
Encyclopaedia Britannica, s.v. “Athanasius Kircher,” accessed July 18, 2017, https://www.britannica.com/biography/Athanasius-Kircher.
Encyclopaedia Britannica, s.v. “Cyclosilicate,” accessed September 19, 2017, https://www.britannica.com/science/cyclosilicate
Encyclopaedia Britannica, s.v. “Eocene Epoch,” accessed September 19, 2017, https://www.britannica.com/science/Eocene-Epoch
Energy Resources Program. “Hydraulic Fracturing and Induced Seismicity.” Energy Resources Program, United State Geological Survey. https://energy.usgs.gov/OilGas/UnconventionalOilGas/HydraulicFracturing.aspx.
Esri. “Surface Coal Mining and Reclamation.” ArcNews, Winter 2011/2012. http://www.esri.com/news/arcnews/winter1112articles/surface-coal-mining-and-reclamation.html.
Fears, Darryl. “Trump Administration Halted a Study of Mountaintop Coal Mining’s Health Effects.” The Washington Post. 21 August 2017. https://www.washingtonpost.com/news/energy-environment/wp/2017/08/21/trump-administration-halted-a-study-of-mountaintop-coal-minings-health-effects/?utm_term=.f0d527a38310.
Flaherty, Kathy J. and Thomas Flaherty, III. Oil and Gas in Pennsylvania. 3rd ed. Harrisburg: Pennsylvania Geological Survey, 2014. http://www.dcnr.state.pa.us/cs/groups/public/documents/document/dcnr_014593.pdf.
Global Volcanism Program. “Mauna Kea.” Global Volcanism Program, Smithsonian Institution. https://volcano.si.edu/volcano.cfm?vn=332030.
Goldman, Nate. “7 Things That Cost Less Than the Big Dig.” Wbur. 12 July 2012. http://legacy.wbur.org/2012/07/12/7-things-that-cost-less-than-the-big-dig.
Greene, Mott T. Geology in the Nineteenth Century: Changing Views of A Changing World. Ithaca: Cornell Univ. Press, 1982. [QE11 .G73 1982]
Grevatt, Peter C. Peter C. Grevatt to EPA Regional Water Division Directors, Regions I-X, 3 November 2015. Lead and Copper Rule Requirements for Optimal Corrosion Control Treatment for Large Drinking Water Systems. http://flintwaterstudy.org/wp-content/uploads/2015/11/LCR-Requirements-for-OCCT-for-Large-DW-Systems-11-03-2015.pdf.
Grueskin, Caroline and Amy Dalrymple. “Environmental Justice Factor into Judge’s Decision on DAPL.” Bismarck Tribune. 16 June, 2017. http://bismarcktribune.com/news/state-and-regional/environmental-justice-factored-into-judge-s-decision-on-dapl/article_a3120c5c-3a58-556a-9e62-dae01f67a9b1.html.
Hanna-Attisha, Mona, Jenny LaChance, Richard Casey Sadler, and Allison Champney Schnepp. “Elevated Blood Lead Levels in Children Associated With the Flint Drinking Water Crisis: A Spatial Analysis of Risk and Public Health Response.” American Journal of Public Health 106.2 (1 February 2016): 283-290. doi: 10.2105/AJPH.2015.303003.
Hawass, Zahi, ed. Pyramids: Treasures, Mysteries and New Discoveries in Egypt. Vercelli, Italy: WS White Star, 2011. [DT63.H39 2011x]
Hitchcock, Charles A. “The Geological Map of the United States.” Transactions of the American Institute of Mining 15 (1886-1887): 465-485. https://babel.hathitrust.org/cgi/pt?id=hvd.32044102927092;view=1up;seq=575.
Hitchcock, Edward. Final Report on the Geology of Massachusetts: In Four Parts: I. Economical Geology. II. Scenographical Geology. III. Scientific Geology. IV. Elementary Geology. With An Appended Catalogue of the Specimens of Rocks and Minerals in the State Collection. Amherst, MA: J.S. & C. Adams, 1841. [QE123 .A15]
Hornberger, Roger J., Caroline M. Loop, Keith B.C. Brady, and Nathan A. Houtz. “Geology of the Pennsylvania Coal Regions.” In Coal Ash. Beneficial Use in Mine Reclamation and Mine Drainage Remediation in Pennsylvania, 20-52. [University Park, Pa.]: Penn State Materials Research Institute, 2004. https://www.dep.state.pa.us/dep/deputate/minres/bmr/beneficial_use/10%20CHAPT%202/Chapter%202%20final.pdf.
“How Long is the Dakota Access Pipeline, and Where Does It Travel?” Dakota Access Pipeline Facts. https://daplpipelinefacts.com/dt_articles/how-long-is-the-dakota-access-pipeline-and-where-does-it-travel/.
Huang, Shawn, Anthony Alvarado, Lyle Zevenbergen and John Cochran. “Assessing the Success of Surface Coal Mine Reclamation: Innovative GIS Tool Automates Watershed Erosion Modeling.” ArcNews 33.4 (Winter 2011/2012) 26-27.
Hyne, Norman J. Nontechnical Guide to Petroleum Geology, Exploration, Drilling and Production. 2nd ed. Tulsa, OK: PennWell Corporation, 2001. [TN870.5.H9624 2001]
Indiana Geological and Water Survey, Indiana University. “Oil and Gas – A Brief Overview of the History of the Petroleum Industry in Indiana.” Indiana Geological and Water Survey. https://igs.indiana.edu/OilGas/History.cfm.
Institute for Astronomy, University of Hawaii. “About Mauna Kea Observatories.” Institute for Astronomy, University of Hawaii. https://www.ifa.hawaii.edu/mko/about_maunakea.shtml.
Jameel, Maryam. “Rural Pennsylvanians Say Fracking ‘Just Ruined Everything’.” Huffington Post. 23 June 2016. http://www.huffingtonpost.com/entry/pennsylvania-fracking-water_us_576b7a76e4b0c0252e786d5e.
Kennedy, Bruce A. “Chapter 1: Introduction.” In Surface Mining, edited by B.A. Kennedy. 2nd ed. Englewood, CO: Society for Mining, Metallurgy, and Exploration Inc. (SME), 1990.
Kennedy, Merrit. “Lead-Laced Water in Flint: A Step-by-Step Look at the Makings of a Crisis.” NPR. 20 April 2016. http://www.npr.org/sections/thetwo-way/2016/04/20/465545378/lead-laced-water-in-flint-a-step-by-step-look-at-the-makings-of-a-crisis.
Laffer, Elliott. Wood Pilings, Goundwater, and the Boston Groundwater Trust: A Model of Cooperative Problem Solving. December 2014. http://www.bostongroundwater.org/uploads/2/0/5/1/20517842/bgwt_history.pdf.
Laskey, Frederick A. A History of Boston’s Water System. 3 April 2014. http://www.mwra.state.ma.us/04water/pdf/040314-water-history-umass.pdf.
Lawrence, David M. “Marie Tharp,” in The History of Cartography: Cartography in the Twentieth Century, vol. 6 part 2, ed. Mark Monmonier. Chicago: Univ. of Chicago Press, 2015. [GA201 .H53 1987]
Lindsey, Rebecca. “Growth of Mountaintop Mine, West Virginia, 1984-2009.” Earth Observatory, National Aeronautics and Space Administration. 3 March 2010. https://earthobservatory.nasa.gov/IOTD/view.php?id=43000.
Lindsey, Rebecca. “Mountaintop Mining, West Virginia.” Earth Observatory, National Aeronautics and Space Administration. https://earthobservatory.nasa.gov/Features/WorldOfChange/hobet.php.
Madabhushi, Babu Srinivas. “What are Trihalomethanes?” On Tap 8, no. 1 (Spring 1999): 18-19. http://www.nesc.wvu.edu/ndwc/articles/qanda/otsp99_q_a.pdf.
Maclure, William. "Observations on the Geology of the United States, Explanatory of a Geological Map." Transactions of the American Philosophical Society 6 (1809): 411-28. doi:10.2307/1004821.
Maclure, William. Suite des Observations sur la Géologie des États-Unis: Servant a l’Explication de la Carte Ci-Jointe. [Paris]: [De l’Imprimerie de Courcier], [1811]. [QE73 .M33 1811]
Massachusetts Department of Transportation. “The Central Artery/Tunnel Project – The Big Dig.” Massachusetts Department of Transportation. http://www.massdot.state.ma.us/highway/TheBigDig.aspx.
Massachusetts Geological Survey. “Geology Links.” Massachusetts Geological Survey. http://mgs.geo.umass.edu/resources/geology-links.
Massachusetts, Metropolitan Sewerage Commission. Report of the Metropolitan Sewerage Commissioners Upon a High-Level Gravity Sewer for the Relief of the Charles and Neponset River Valleys. Boston: Wright & Potter Printing Co., 1899. [GOV DOCS M3/SEG/899.1]
Massachusetts Water Resources Authority. “A History of the Sewer System.” Massachusetts Water Resources Authority. http://www.mwra.state.ma.us/03sewer/html/sewhist.htm.
Maxwell, Rebecca. “Marie Tharp and Mapping the Ocean Floor.” GIS Lounge. https://www.gislounge.com/marie-tharp-and-mapping-ocean-floor/.
Morgenroth, Lynda. Boston Firsts: 40 Feats of Innovation and Invention that Happened First in Boston and Helped Make America Great. Boston: Beacon Press, 2006. [F73.36.M67 2006]
Moskowitz, Eric. “True Cost of Big Dig Exceeds $24 Billion with Interest, Officials Determine.” Boston.com. 10 July 2012. https://www.boston.com/uncategorized/noprimarytagmatch/2012/07/10/true-cost-of-big-dig-exceeds-24-billion-with-interest-officials-determine.
Most, Doug. The Race Underground: Boston, New York, and the Incredible Rivalry that Built America’s First Subway. New York: St. Martin’s Press, 2014. [HE4491.B782 M67 2014]
“Mount Hope Cemetery.” City of Boston. 13 July 2016. https://www.boston.gov/cemetaries/mount-hope-cemetery.
National Institute for Occupational Safety and Health. “Coal Industry Sector.” The National Institute for Occupational Safety and Health, Centers for Disease Control and Prevention. https://www.cdc.gov/niosh/mining/statistics/CoalSector.html.
National Oceanic and Atmospheric Administration. “What is Bathymetry?” National Ocean Service. https://oceanservice.noaa.gov/facts/bathymetry.html.
National Park Service. “What’s Going On With the Volcano?” National Park Service. https://www.nps.gov/havo/planyourvisit/lava2.htm.
National Park Service. “Yellowstone National Park.” National Park Service. https://www.nps.gov/yell/index.htm.
National Weather Service. “National Weather Service Glossary.”
National Weather Service. http://w1.weather.gov/glossary/.
Nesson, Fern L. Great Waters: A History of Boston’s Water Supply. Hanover, NH: Published for Brandeis University by University Press of New England, 1983. [TD225.B7 B7 N47 1983]
Nystrom, Eric C. Seeing Underground: Maps, Models and Mining Engineering in America. Reno: Univ. Of Nevada Press, 2014. [TN273 .N97 2014]
Office of Coast Survey. “History of Coast Survey.” Office of Coast Survey. https://www.nauticalcharts.noaa.gov/staff/hist.html.
Office of Surface Mining Reclamation and Enforcement. Office of Surface Mining Reclamation and Enforcement. https://www.osmre.gov/index.shtm.
Oreskes, Naomi, ed. Plate Tectonics: An Insider’s History of the Moderns Theory of the Earth. Boulder, Colorado: Westview Press, 2001. [QE511.4 .P53 2001x]
Palladino, Grace. Another Civil War: Labor, Capital, and the State in the Anthracite Regions of Pennsylvania, 1840-68. Urbana and Chicago: Univ. of Illinois Press, 1990. [HD8039.M62 V6493 1990]
Palmer, M. A., E. S. Bernhardt, W. H. Schlesinger, K. N. Eshleman, E. Foufoula-Georgiou, M. S. Hendryx, A. D. Lemly, G. E. Likens, O. L. Loucks, M. E. Power, P. S. White, and P. R. Wilcock. "Mountaintop Mining Consequences." Science, New Series, 327, no. 5962 (2010): 148-49. http://www.jstor.org/stable/40508802.
Penn State University Libraries. “Coal in Pennsylvania.” Pennsylvania Mines and Mining, Penn State University Libraries. http://guides.libraries.psu.edu/c.php?g=332704&p=2236157.
Pennsylvania Anthracite Heritage Museum. Pennsylvania Anthracite Heritage Museum. http://www.anthracitemuseum.org/.
Pennsylvania Department of Environmental Protection. “Pennsylvania Mining History.” Mine Subsidence Insurance. http://www.dep.state.pa.us/msi/mininghistory.html.
Polly, David, Brian Speer, Sarah Rieboldt and David Smith. “Green River Formation: Plants & Algae.” University of California Museum of Paleontology. 15 June 2011. http://www.ucmp.berkeley.edu/tertiary/eoc/greenplants.html
Polly, David, Brian Speer, Sarah Rieboldt and David Smith. “The Green River Formation.” University of California Museum of Paleontology. 15 June 2011. http://www.ucmp.berkeley.edu/tertiary/eoc/greenriver.html
"Putnam, Frederic Ward." In International Encyclopedia of the Social Sciences, vol. 13, edited by David L. Sills, 222-223. New York: Macmillan, 1968. Gale Virtual Reference Library (accessed August 15, 2017). http://libraries.state.ma.us/login?gwurl=http://go.galegroup.com/ps/i.do?p=GVRL&sw=w&u=mlin_b_bpublic&v=2.1&it=r&id=GALE%7CCX3045001023&asid=163cd70152d9459fa2e71c35c1c72a63.
Redfern, Martin. The Earth: A Very Short Introduction. Oxford: Oxford Univ. Press, 2003. [QE26.3 .R43 2003]
Ricketts, Palmer C. History of Rensselaer Polytechnic Institute, 1824-1914. New York: John Wiley and Sons, 1914. https://archive.org/stream/historyofrenssel00rick.
Robinson, Arthur H. Early Thematic Mapping in the History of Cartography. Chicago: Univ. of Chicago Press, 1982. [GA201.R63 1982]
“Route.” Dakota Access Pipeline Facts. https://daplpipelinefacts.com/route/.
Rupp, John A. “Oil and Gas – A Brief Overview of the History of the Petroleum Industry in Indiana.” Indiana Geological and Water Survey. https://igs.indiana.edu/oilgas/.
Scarth, Alwyn. Vesuvius: A Biography. Princeton, NJ: Princeton Univ. press, 2009. [QE523.V5S23 2009]
Sheafer, Peter Wenrick. The Anthracite Coal Fields of Pennsylvania and Their Exhaustion. Harrisburg: Lane S. Hart, 1881. https://books.google.com/books?id=u70oAQAAMAAJ&printsec=frontcover.
Slonecker, E. T., L. E. Milheim, C. M. Roig-Silva, and S. G. Winters. Landscape Consequences of Natural Gas Extraction in Bedford, Blair, Cambria, Centre, Clearfield, Clinton, Columbia, Huntingdon and Luzerne Counties, Pennsylvania, 2004-2010. Reston, Va.: U.S.Geological Survey, 2014. https://pubs.er.usgs.gov/publication/ofr20141089.
Smith, Craig B. How the Great Pyramid Was Built. Washington, DC: Smithsonian Books, 2004. [DT63.S6 2004]
Smith, William. A Classical Dictionary of Greek and Roman Biography, Mythology, and Geography. Revised and rewritten by G. E. Marindin. London: John Murray, 1894. [2983.7]
Standing Rock Sioux Tribe. Standing Rock Sioux Tribe. https://www.standingrock.org/
Standing Rock Sioux Tribe. “History.” Standing Rock Sioux Tribe. https://www.standingrock.org/content/history.
Stein, Aurel. “An Archaeological Tour in the Ancient Persis.” The Geographical Journal 86.6. (1935): 489-497. http://www.jstor.org/stable/1786254.
Surface Coal Mining and Reclamation Operations; Excess Spoil; Stream Buffer Zones; Diversions; Proposed Rule, 69 FR 1035 (2004). https://www.gpo.gov/fdsys/pkg/FR-2004-01-07/pdf/04-266.pdf.
Thys, Fred. “Continued Drought Spells Concern About Building Foundations in Back Bay.” Wbur. 31 October 2016. http://www.wbur.org/morningedition/2016/10/31/drought-back-bay.
Union of Concerned Scientists. “How Coal Works.” Union of Concerned Scientists. http://www.ucsusa.org/clean_energy/coalvswind/brief_coal.html#.WZyZ6Lb7K70.
United States Department of Energy. Shale Gas Glossary. https://energy.gov/sites/prod/files/2013/04/f0/shale_gas_glossary.pdf.
United States Energy Information Administration. “About U.S. Natural Gas Pipelines: Transporting Natural Gas.” U.S. Energy Information Administration. https://www.eia.gov/naturalgas/archive/analysis_publications/ngpipeline/index.html.
United States Energy Information Administration. “U.S. Underground Natural Gas Storage Facilities, Close of 2007.” U.S. Energy Information Administration. https://www.eia.gov/naturalgas/archive/analysis_publications/ngpipeline/undrgrndstor_map.html.
United States Energy Information Administration. “West Virginia: State Profile and Energy Estimates.” U.S. Energy Information Administration. https://www.eia.gov/state/analysis.php?sid=WV.
United States Energy Information Administration. “Oil: Crude and Petroleum Products Explained: Where is U.S. Crude Oil Produced?” U.S. Energy Information Administration. https://www.eia.gov/energyexplained/index.cfm?page=oil_where.
United States Energy Information Administration. “Natural Gas Explained: Where Our Natural Gas Comes From.” U.S. Energy Information Administration. https://www.eia.gov/energyexplained/index.cfm?page=natural_gas_where.
United States Environmental Protection Agency. “Basic Information about Surface Coal Mining in Appalachia.” United States Environmental Protection Agency. https://www.epa.gov/sc-mining/basic-information-about-surface-coal-mining-appalachia.
United State Environmental Protection Agency. “EPA Releases Preliminary Results for Surface Coal Mining Permit Reviews.” United States Environmental Protection Agency. 11 September 2009. https://yosemite.epa.gov/opa/admpress.nsf/a883dc3da7094f97852572a00065d7d8/b746876025d4d9a38525762e0056be1b!OpenDocument.
United States Environmental Protection Agency. “The Process of Hydraulic Fracturing.” Environmental Protection Agency. https://www.epa.gov/hydraulicfracturing/process-hydraulic-fracturing.
United States Geological Survey. Divisions of Geologic Time: Major Chronostratigraphic and Geochronologic Units. https://pubs.usgs.gov/fs/2010/3059/pdf/FS10-3059.pdf.
United States v. Sioux Nation of Indians, 448 U.S. 371 (1980). http://caselaw.findlaw.com/us-supreme-court/448/371.html.
University of California, Berkeley Library. Standing Rock and the Dakota Access Pipeline: Native American Perspectives. http://guides.lib.berkeley.edu/c.php?g=585158&p=4041386&preview=f874a7f514c512602507893b1e6981ef.
University of New Hampshire Library. “More on Charles Hitchcock.” University of New Hampshire Library. http://docs.unh.edu/Hitchcock/pages/more.htm.
Victoria and Albert Museum. “Sir Aurel Stein.” Victoria and Albert Museum. http://www.vam.ac.uk/content/articles/s/sir-aurel-stein/.
Vigil, José F., Richard J. Pike, and David G. Howell. A Tapestry of Time and Terrain. [Reston, Va.]: United States Geological Survey, 2009. https://pubs.usgs.gov/imap/i2720/.
Volcano Hazards Program. “Mauna Kea.” Volcano Hazards Program, United State Geological Survey. https://volcanoes.usgs.gov/volcanoes/mauna_kea/.
Wang, Helen and John Perkins, eds. Handbook to the Collections of Sir Aurel Stein in the UK. 2nd revised ed. London: The British Museum, 2008. http://www.britishmuseum.org/pdf/Stein%20Handbook%20final(3).pdf.
West Virginia Geological and Economic Survey. “History of WV Mineral Industries – Oil and Gas.” West Virginia Geology. http://www.wvgs.wvnet.edu/www/geology/geoldvog.htm.
Wick, Peter. A Handbook to the Art and Architecture of the Boston Public Library. Boston: The Associates of the Boston Public Library, 1977. https://archive.org/details/handbooktoartarc00wick.
WITF. “Overview: Mining Anthracite.” ExplorePAhistory.com. http://explorepahistory.com/story.php?storyId=1-9-B.
Woods Hole Coastal and Marine Science Center. “Map of Backscatter Intensity and Shaded Relief of the Region Offshore of Boston, Massachusetts.” Woods Hole Coastal and Marine Science Center, United States Geological Survey. https://woodshole.er.usgs.gov/project-pages/bostonharbor/outfall_backscatter.html.
"Wyman, Jeffries." In Complete Dictionary of Scientific Biography, vol. 14, 532-534. Detroit: Charles Scribner's Sons, 2008. Gale Virtual Reference Library (accessed August 15, 2017). http://libraries.state.ma.us/login?gwurl=http://go.galegroup.com/ps/i.do?p=GVRL&sw=w&u=mlin_b_bpublic&v=2.1&it=r&id=GALE%7CCX2830904740&asid=a414ed0f02adae772040e02acbeb77ba.
Zerkel, Eric. “Kalapana, Hawaii Burning: The History of Kilauea’s Catastrophic Lava Flow.” The Weather Channel. https://weather.com/news/news/kalapana-hawaii-kilauea-lava-flow-20141008.
Credits
Curator
Stephanie Cyr
Norman B. Leventhal Map Center Staff
Lauren Chen, Senior Cataloger
Connie Chin, President
Alison Cody, Development Manager
Stephanie Cyr, Associate Curator
Ronald Grim, Curator of Maps
Dory Klein, Education Assistant
Michelle LeBlanc, Director of Education
Catherine Wood, Office Manager
Education materials created by:
Michelle LeBlanc, Director of Education
Dory Klein, Education Assistant
Interactive and digital maps created by:
Lauren Chen, Senior Cataloger
Liam Numrich, Cartographic Project Assistant
Framing and Matting
Andrew Leonard
Boston Public Library Staff
Communications Dept.
Digital Services
Facilities Dept.
IT Dept.
Graphic Design and Production
Neva Corbo-Hudak Graphic Design
Lenders
City of Boston Archaeology Lab
Harvard Mineralogical & Geological Museum, Cambridge, MA
Private collection
Special Thanks
Joseph Bagley, City Archaeologist, Boston, MA
Stephen Brophy, Lecturer, MIT Comparative Media Studies/Writing
Suanna Selby Crowley and Staff, The Metropolitan Waterworks Museum, Boston, MA
Theresa Smith, Kevin Czeja and Staff,
Harvard Mineralogical & Geological Museum, Cambridge, MAPress
These Maps Give a Fascinating Look at What Lies Under the Ground We Walk On
Washington Post, November 26, 2017
Four Centuries of Mapping the Subterranean World
Hyperallergic, November 21, 2017
A New Map Exhibit Documents Evolving Views of Earth's Interior
ScienceNews, November 19, 2017
At the BPL, Maps of Things Otherwise Unseen
Boston Globe, October 20, 2017