Toggle navigation
LMEC Home
Exhibitions
Georeferencing
Tools for Teachers
Collections
My Favorites
Sign Up / Log In
Search
Search the map portal
Map Collection
Map Collection
Map Sets
Search
Search
Search for
Search In
All Fields
Creator
Title
Subject
Place
Search All Digital Collections
Advanced Search
25 Results
My Search
Start Over
Date
2020
to
2021
Remove constraint Date: <span class='from'>2020</span> to <span class='to'>2021</span>
Filter your Search
Place
North and Central America
24
United States
16
Boston
14
Suffolk (county)
14
Massachusetts
9
New England
1
Topic
Boston (Mass.)--Maps
10
Massachusetts--Maps
9
Hazardous waste sites--Massachusetts--Maps
4
Internet access--Massachusetts--Boston--Maps
3
Commuting--Massachusetts--Boston--Maps
2
Immigrants--Massachusetts--Boston--Maps
2
Local transit--Massachusetts--Boston--Maps
2
Open spaces--Massachusetts--Maps
2
more
Topic
»
Date
2020
to
2021
[remove]
25
Date range begin
–
Date range end
Current results range from
2020
to
2021
2020
to
2020
24
2021
to
2021
1
Creator
Boston Public Library. Norman B. Leventhal Map and Education Center
24
Huffman, Daniel P.
9
Owens, Margaret
2
Tierney, Lauren C.
2
Wolfe, Julia
2
Woodruff, Andy
2
Bay, Elaine, 1976-
1
Draper, Madison
1
more
Creator
»
Format
Maps/Atlases
25
Georeferenced
No
25
Collection
Norman B. Leventhal Map Center Collection
25
Boston and New England Maps
22
Urban Maps
1
Available to use
Creative Commons license
21
No known restrictions
4
Search Constraints
Sort by relevance
relevance
title
date (asc)
date (desc)
Number of results to display per page
10 per page
10
per page
20
per page
50
per page
100
per page
View results as:
grid view
map view
Search Results
1.
Boston kids count
2.
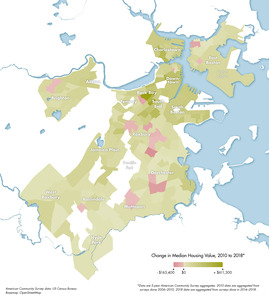
Change in median housing value, 2010 to 2018
3.
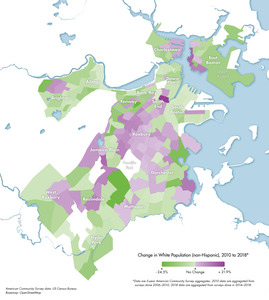
Change in white population (non-Hispanic), 2010 to 2018
4.
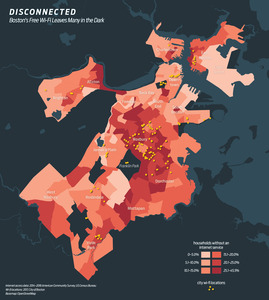
Disconnected : Boston's free wi-fi leaves many in the dark
5.
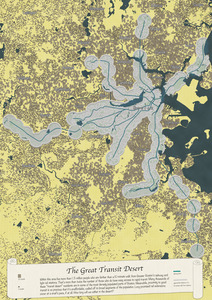
The great transit desert
6.
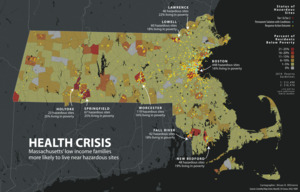
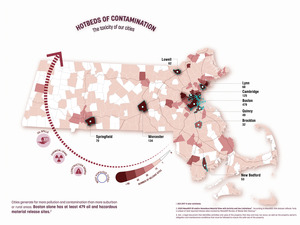
Health crisis : Massachusetts' low income families more likely to live near hazardous sites
7.
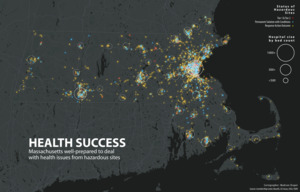
Health success : Massachusetts well-prepared to deal with health issues from hazardous sites
8.
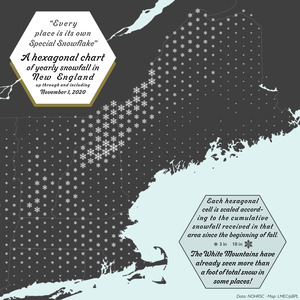
A hexagonal chart of yearly snowfall in New England up through and including November 1, 2020
9.
Hotbeds of contamination : the toxicity of our cities
10.
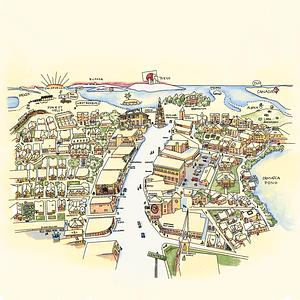
Jamaica Plain view of the world
‹ Prev
Next ›
1
2
3