Mean monthly average temperature
Item Information
- Title:
- Mean monthly average temperature
- Title (alt.):
-
Monthly average temperature
National atlas, monthly average temperature
- Description:
-
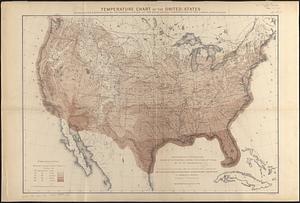
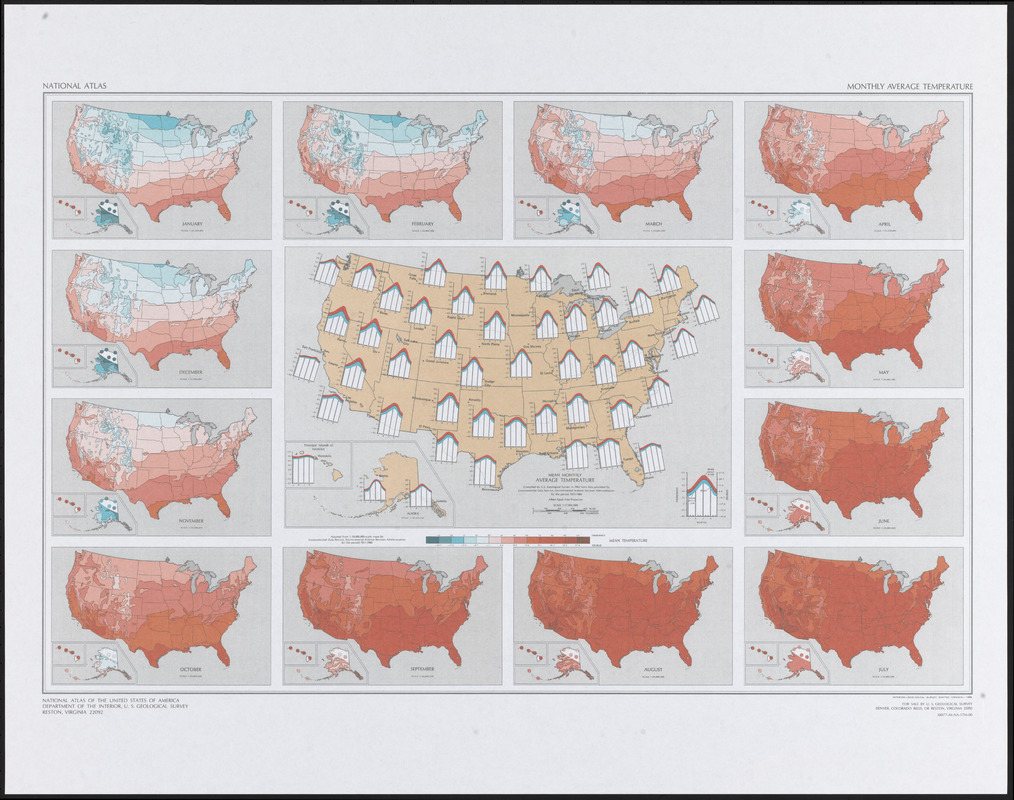
Regions and Seasons: By the 20th century, digital technologies had replaced the older, manual mapmaking processes of copperplate engraving and lithography. However, visual techniques first developed in the mid-19th century such as shading variations were, and are still employed in thematic maps. This modern map illustrates monthly average temperatures for the United States from 1931-1960 using isotherms and a color scale from cold blues to warm reds. The large map in the center shows daily mean high and low temperatures during January, April, July and October for major cities across the country using two colors and a bar graph.
- Creator:
- Geological Survey (U.S.)
- Cartographer:
- Geological Survey (U.S.)
- Name on Item:
-
compiled by U.S. Geological Survey in 1965
- Date:
-
1986
- Format:
-
Maps/Atlases
- Location:
-
Boston Public Library
Norman B. Leventhal Map & Education Center - Collection (local):
-
Norman B. Leventhal Map & Education Center Collection
- Subjects:
-
Atmospheric temperature--United States--Maps
United States--Maps
- Places:
-
United States
- Extent:
- 13 maps on 1 sheet : color ; 20 x 32 cm and 10 x 16 cm, on sheet 48 x 71 cm.
- Terms of Use:
-
No known copyright restrictions.
No known restrictions on use.
- Publisher:
-
Reston, Va. :
Geological Survey
- Scale:
-
Scale 1:17,000,000 and 1:34,000,000
- Projection:
- Albers equal area projection
- Language:
-
English
- Notes:
-
Based on data provided by Environmental Data Service, Environmental Science Services Administration for the period 1931-1960.
Includes a map with insets of Alaska and Hawaii for each month.
"38077-AK-NA-17M-00."
- Notes (exhibitions):
-
Exhibited: "Regions and Seasons: Mapping Climate through History" organized by the Norman B. Leventhal Map Center at the Boston Public Library, 2017.
- Identifier:
-
06_01_015941
- Call #:
-
G3701.C82 1986 .G46
- Barcode:
-
39999085942025