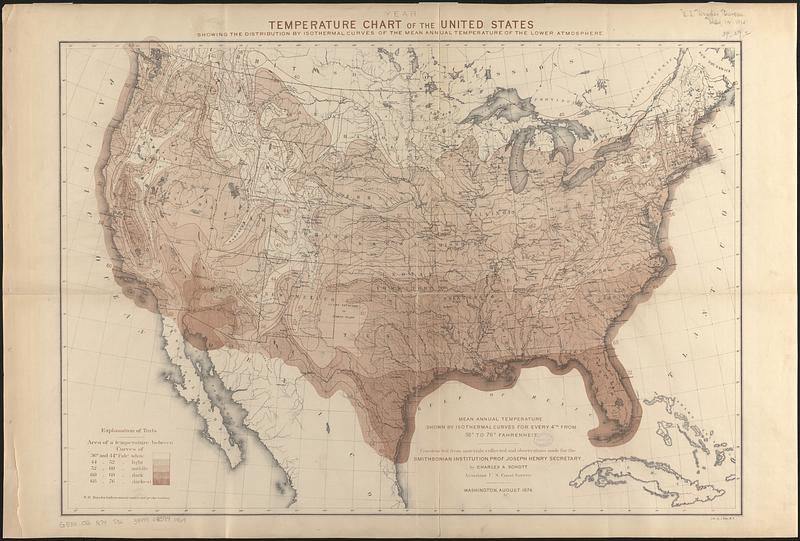
Temperature chart of the United States : showing the distribution by isothermal curves of the mean annual temperature of the lower atmosphere
Item Information
- Title:
- Temperature chart of the United States : showing the distribution by isothermal curves of the mean annual temperature of the lower atmosphere
- Cartographer:
- Schott, Charles A. (Charles Anthony), 1826-1901
- Lithographer:
- Bien, Julius, 1826-1909
- Publisher:
- Smithsonian Institution
- Name on Item:
-
constructed from materials collected and observations made for the Smithsonian Institution, Prof. Joseph Henry, Secretary, by Charles A. Schott, Assistant U.S. Coast Survey
- Date:
-
1874
- Format:
-
Maps/Atlases
- Genre:
-
Thematic maps
- Location:
-
Boston Public Library
Norman B. Leventhal Map & Education Center - Collection (local):
-
Norman B. Leventhal Map & Education Center Collection
- Subjects:
-
United States--Maps
Atmospheric temperature--United States--Maps
- Places:
-
United States
- Extent:
- 3 maps : color ; 50 x 71 cm
- Terms of Use:
-
No known copyright restrictions.
No known restrictions on use.
- Publisher:
-
Washington :
[Smithsonian Institution]
- Scale:
-
Scale approximately 1:7,000,000
- Language:
-
English
- Table of Contents:
-
Year
Winter
Summer
- Notes:
-
Year map shows mean annual temperature.
Winter map shows mean temperature from December 1873 to February 1874.
Summer map shows mean temperature from June to August 1874.
- Identifier:
-
06_01_015924
06_01_015925
06_01_015926
- Call #:
-
G3701.C82 1874 .S36
- Barcode:
-
39999085941969


