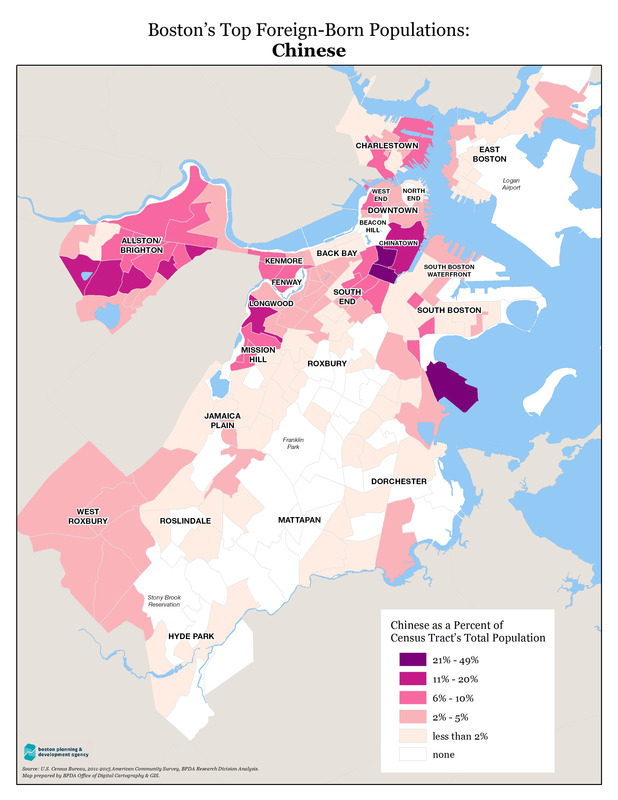
Boston's top foreign-born populations : Chinese
Item Information
- Title:
- Boston's top foreign-born populations : Chinese
- Description:
-
According to the U.S Census Bureau, the patterns of immigration to Boston during the first decades of the 21st century are much different than those of the first decades of the 20th century. Currently the majority of immigrant groups come from the Caribbean (28.8%) and Asia (27.8%), while those coming over 100 years ago came mainly from Europe (Ireland, Italy, and Russia).
- Cartographer:
- Boston Planning and Development Agency
- Name on Item:
-
Map prepared by BPDA Office of Digital Cartography & GIS
- Date:
-
[2017]
- Format:
-
Maps/Atlases
- Location:
-
Boston Public Library
Norman B. Leventhal Map & Education Center - Collection (local):
-
Norman B. Leventhal Map & Education Center Collection
- Subjects:
-
Boston (Mass.)--Maps
Immigrants--Massachusetts--Boston--Maps
Chinese--Massachusetts--Boston--Maps
- Places:
-
MassachusettsSuffolk (county)Boston
- Extent:
- 1 map : color
- Terms of Use:
-
No known copyright restrictions.
No known restrictions on use.
- Publisher:
-
Boston :
Boston Planning & Development Agency
- Language:
-
English
- Notes:
-
"Source: U.S. Census Bureau, 2011-2015 American Community Survey, BPDA Research Division Analysis."
- Notes (date):
-
This date is inferred.
- Notes (exhibitions):
-
Exhibited: "Who We Are: Boston Immigration Then and Now," organized by the Norman B. Leventhal Map Center at the Boston Public Library, 2017.
- Identifier:
-
2015_Foreign_Born_-_Chinese


