Boston's diversity index, 2010 : measures of diversity : age
Item Information
- Title:
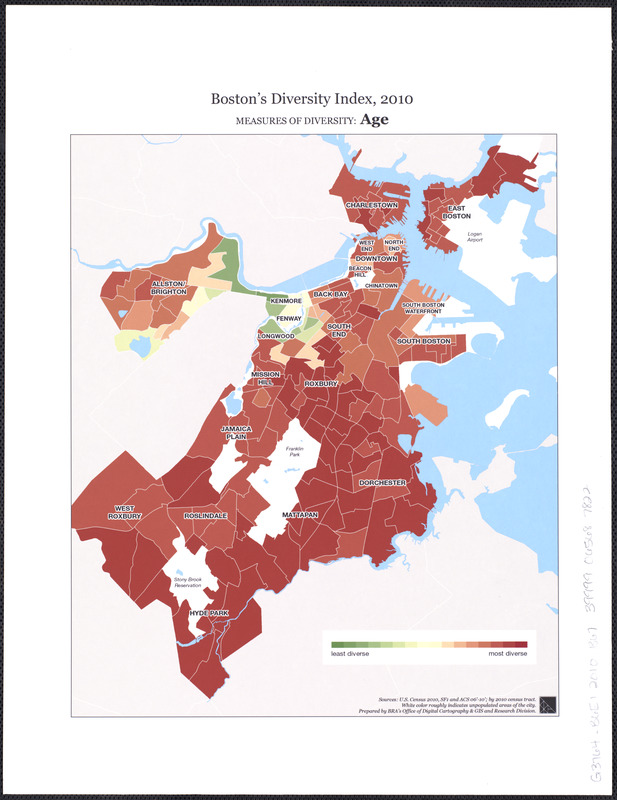
- Boston's diversity index, 2010 : measures of diversity : age
- Description:
-
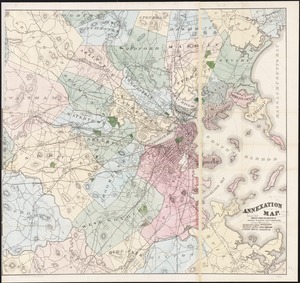
Another series of maps produced by the Boston Redevelopment Authority shows different measures of diversity, including race, language, age, household income, education, and region of birth. Census tracts on each map range in color from deep orange (indicating the most diverse neighborhoods) to deep green (least diverse). By comparing these various maps, it is evident that the most diverse census tracts are located in Dorchester, Roxbury, Roslindale, East Boston, and Brighton.
- Cartographer:
- Boston Redevelopment Authority. Office of Digital Cartography & GIS
- Name on Item:
-
prepared by BRA's Office of Digital Cartography & GIS and Research Division
- Date:
-
[2014]
- Format:
-
Maps/Atlases
- Location:
-
Boston Public Library
Norman B. Leventhal Map & Education Center - Collection (local):
-
Norman B. Leventhal Map & Education Center Collection
- Subjects:
-
Boston (Mass.)--Maps
Age distribution (Demography)--Massachusetts--Boston--Maps
- Places:
-
MassachusettsSuffolk (county)Boston
- Extent:
- 1 map : color ; 30 x 25 cm
- Terms of Use:
-
No known copyright restrictions.
No known restrictions on use.
- Publisher:
-
Boston :
Boston Redevelopment Authority
- Scale:
-
Scale approximately 1:67,500
- Language:
-
English
- Notes (date):
-
This date is inferred.
- Notes (exhibitions):
-
Exhibited: "City of Neighborhoods: The Changing Face of Boston" organized by the Norman B. Leventhal Map Center at the Boston Public Library, 2014.
- Identifier:
-
06_01_011623
- Call #:
-
G3764.B6E1 2010 .B67
- Barcode:
-
39999065687822