Boston: A City of Immigrants/1850–2015 Foreign-Born in Boston, MA & the United States
Information
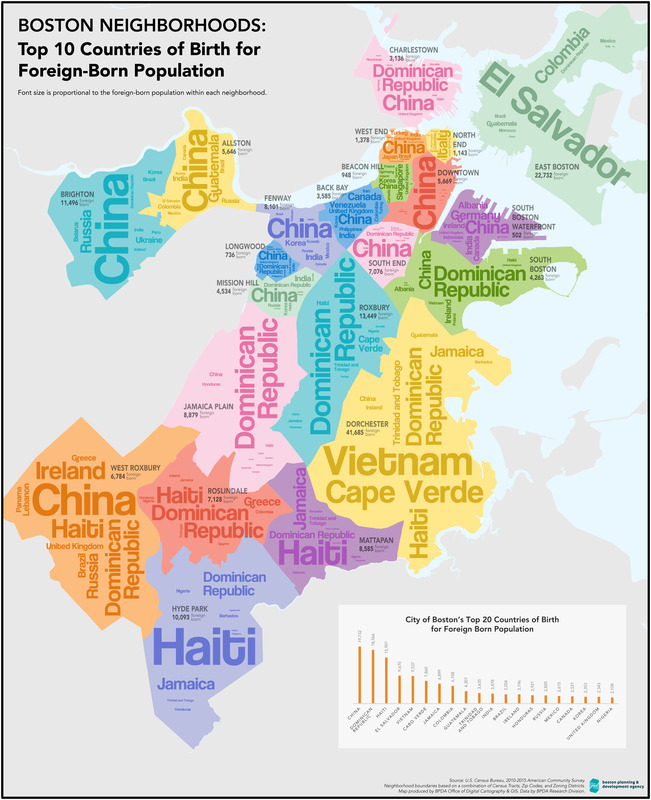
Inspired by the Leventhal Map Center exhibition "Who We Are: Boston Immigration Then and Now" and in coordination with the Boston Planning and Development Agency Research Division, this investigation has students think critically about a 1850–2015 time series graph of the share of Boston, MA, & US population that is foreign-born. Using the critical thinking strategy "What Do You Notice? / What Do You Wonder?", students develop their own questions that can be answered from the graph. The mathematics focuses on the use of percentage (or share) and number (or count) and how to calculate and communicate them. Share and percentage can be used here interchangeably. Share is a non-statistical term. Percentage is a number 0–100 and is expressed with a “%”. Number and count can be used here interchangeably. Number is a general term with many meanings. Count is a statistical term. The humanities focus is on how immigration affects population composition.
- Material Type:
- Lesson Plan
- Grade Level:
- 6, 7, 8, 9, 10, 11, 12
- Subjects:
- 1945 to the Present, Boston Neighborhoods, Math and Maps
- Location:
- Boston, United States
- Time Period:
- 1850-2015
