The world according to Standard (N.J.)
Item Information
- Title:
- The world according to Standard (N.J.)
- Description:
-
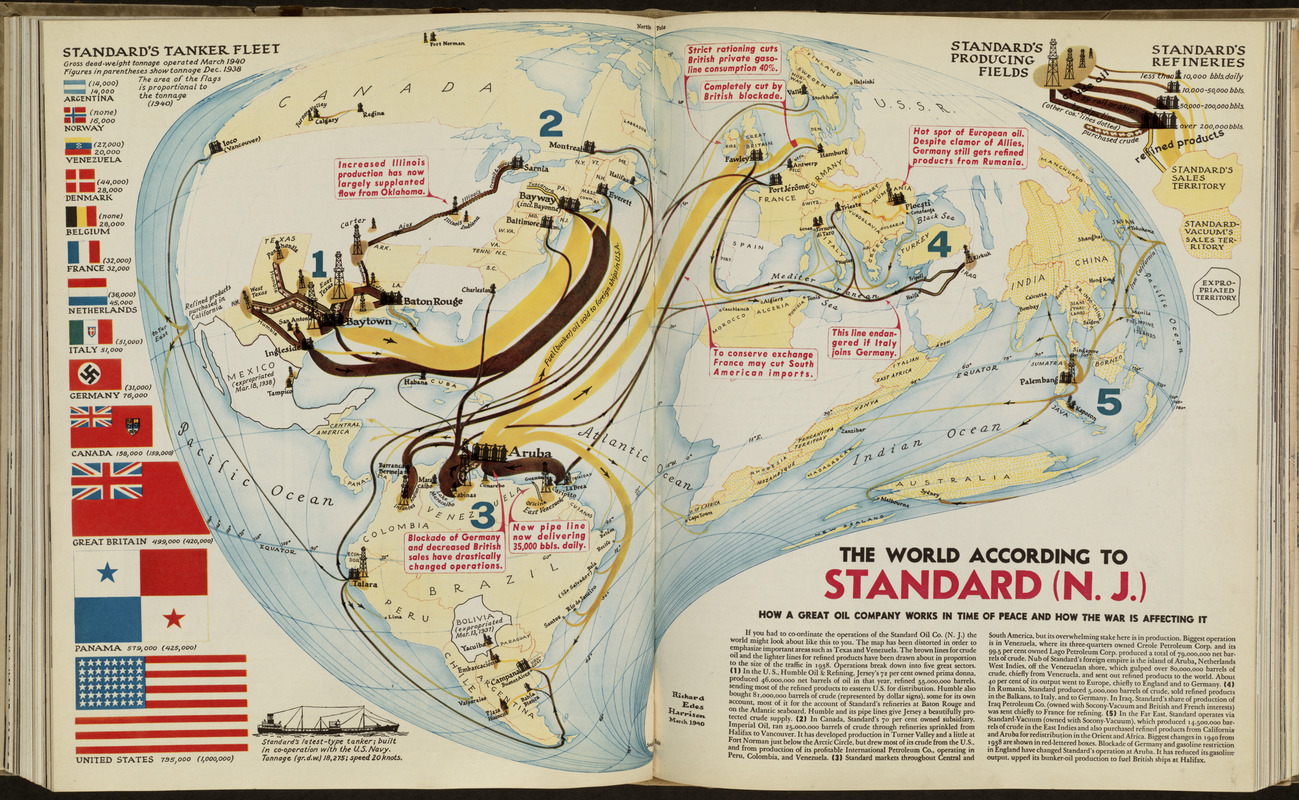
This unusual but visually arresting world map provides an excellent example for examining a map's overall design. Because of the obvious distortion in this map, the reader is more receptive to looking for the map's message. The map was prepared by freelance cartographer Richard Harrison who regularly did contract work for ''Fortune'' magazine during the late 1930s and 1940s. For this assignment, he prepared a map to illustrate a series of three articles on the Standard Oil Company of New Jersey in the April, May, and June 1940 issues of ''Fortune''. His double-page map was included in the second article subtitled, "How a great oil company works in time of peace and how the war is affecting it." The article emphasized the company's international operations at the beginning of World War II. Through the combination of a unique projection and creative symbols, Harrison was able to graphically portray the author's thesis: "The world of the Jersey company is the closest thing to empire that U.S. industry manages. It is a world that works in twenty-four time zones, that speaks most civilized languages, that operates in over fifty independent countries. It is a maritime world as dependent on its tanker fleet as England on its merchant marine. And like the captains of its tankers, the management of the Jersey company has come to adopt a point of view that expects both fair weather and foul, calm followed by storm, peace followed by war." Rather than use a conventional projection such as the Mercator or an interrupted projection, Harrison, who is known for his innovative solutions in cartographic design, invented a world projection, which could aptly be called an "oil drop projection." This creative solution allowed him to emphasize and bring to the forefront Texas and Venezuela, Standard Oil's major areas of crude oil production, and Aruba, the site of the company's largest refinery. Consequently, the primary focus of the map was those portions of the company's operations that were the most profitable. Since the company's operations were global, the rest of the world is shown, but those sales areas that were less profitable, especially eastern Africa, southeastern and eastern Asia, and Australia are shown in diminished size at the fringes of the map. Using a number of symbol types, Harrison illustrated the complexity of the company's operations. Pictorial point symbols, drawn in various sizes, show areas of crude oil production (oil derricks) and the location of refineries (refineries). Flow lines show the movement of crude oil (colored dark brown) and refined oil (shown in a lighter yellow) by pipeline or tanker. Highlighted comments describe particular areas of difficulties for the company at the beginning of the war: Great Britain's rationing of private automobile gasoline, the British blockade of Germany, and the nationalistic expropriation of operations in Mexico and Bolivia. An interesting adjunct is the series of flags in the left margin which serve as a graph indicating the tonnage of the Standard Oil fleet registered in different countries. As Harrison stated, his objective was to show what the world would look like from the perspective of the Standard Oil Company's top executives, as they had to co-ordinate the global activities of their corporate empire in the face of an impending world-wide war.
- Cartographer:
- Harrison, Richard Edes
- Date:
-
1940
- Format:
-
Maps/Atlases
- Location:
-
Boston Public Library
Central Library in Copley Square - Collection (local):
-
Boston Public Library Collection
- Subjects:
-
World maps
Petroleum industry and trade--Maps
- Places:
-
World
- Extent:
- 1 map : color ; 36 x 63 cm
- Terms of Use:
-
Copyright © Time, inc.
All rights reserved.
- Publisher:
-
New York, NY :
Time
- Language:
-
English
- Notes:
-
Published in ''Fortune'', vol. 21, no. 5 (May 1940)
- Notes (exhibitions):
-
Exhibited: "Journeys of the Imagination" organized by the Norman B. Leventhal Map Center at the Boston Public Library, 2006.
Exhibited: "Unconventional Maps: Exploring the Stories of Cartographic Curiosities" organized by the Norman B. Leventhal Map Center at the Boston Public Library, 2011-2012.
- Identifier:
-
05_01_000232