Boston’s Foreign-Born Population/Who? Where? How Many?
Information
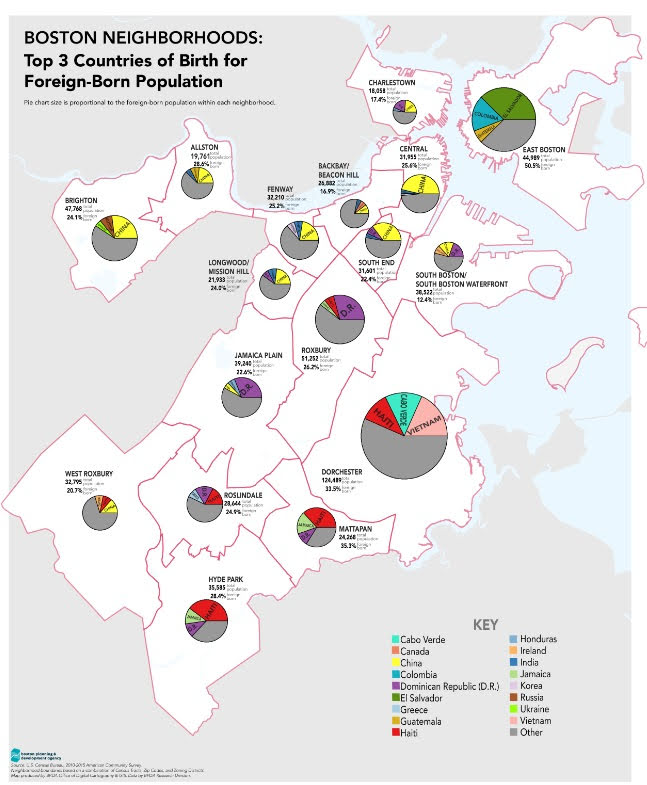
Inspired by the Leventhal Map Center exhibition "Who We Are: Boston Immigration Then and Now" and in coordination with the Boston Planning and Development Agency Research Division, this investigation has students think critically about the 2015 foreign-born population data for Boston and its neighborhoods. Students analyze a data table, graph the data, and discuss their findings using the critical thinking strategy "What Do You Notice?/What Do You Wonder?". They reflect on a Boston neighborhood map that incorporates the data and develop their own questions that can be answered from the table, graphs, and map. The mathematics focuses on proportionality for different sized populations. Students calculate proportions and construct segmented bar graphs. They analyze and discuss how to compare the bar graphs. The humanities focus is on how country of origin of foreign born varies among Boston neighborhoods and has changed over time.
- Material Type:
- Lesson Plan
- Grade Level:
- 6, 7, 8, 9, 10, 11, 12
- Subjects:
- American History Across the Eras, Boston Neighborhoods, Math and Maps
- Location:
- Boston, United States
- Time Period:
- 2015